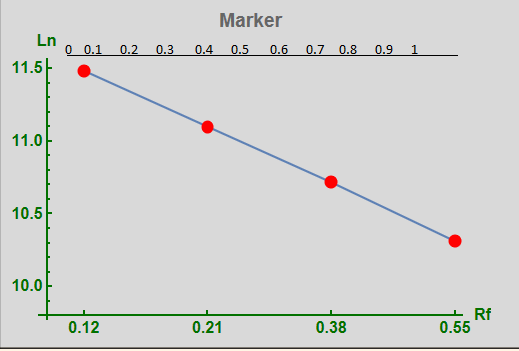
How to place certain values on the x-axis below and other values above in PlotRange. Below must be the calculated values and above values in the range 0-1.
ListLinePlot[Marker = Log[{97000., 66000., 45000., 30000.}],
 Ticks -> {{{1, "0.12"}, {2, "0.21"}, {3, "0.38"}, {4, "0.55"}, {5,
     ".75"}, {5, "0.7"}, {6, "0.8"}, {7, "0.9"}, {8, "1."}},  Automatic, {0, 1}}, Mesh -> All,
 MeshStyle -> {PointSize[0.03], Red}, AxesLabel -> {"Rf", "Ln"},
 LabelStyle -> Directive[Bold, 12],
 PlotLabel -> HoldForm[Marker], AxesOrigin\[Rule]{.7, 9.8},
 AxesStyle -> Directive[RGBColor[0.00613, 0.444, 0.], AbsoluteThickness[1.5]]]