Perhaps like so.
In[11]:= evalsNumeric = Table[eValues, {\[Gamma], -1.0, 1.0, .1}]

Out[11]= {{-4.00361, -0.808944, 6.08572}, {-3.98203, -0.794523,
  6.67971}, {-3.96729, -0.734832, 7.29529}, {-3.95814, -0.630883,
  7.93219}, {-3.95238, -0.484699, 8.59025}, {-3.94722, -0.298905,
  9.2693}, {-3.93973, -0.0763196, 9.96921}, {-3.92708, 0.180351,
  10.6899}, {-3.90677, 0.468684, 11.4312}, {-3.87665, 0.78661,
  12.1932}, {-3.83495, 1.13241, 12.9757}, {-3.7802, 1.50467,
  13.7787}, {-3.71122, 1.90225, 14.6021}, {-3.62705, 2.32425,
  15.446}, {-3.5269, 2.76991, 16.3102}, {-3.41015, 3.23864,
  17.1947}, {-3.27629, 3.72995, 18.0995}, {-3.1249, 4.24344,
  19.0246}, {-2.95562, 4.7788, 19.97}, {-2.76817, 5.33574,
  20.9356}, {-2.56231, 5.91406, 21.9214}}
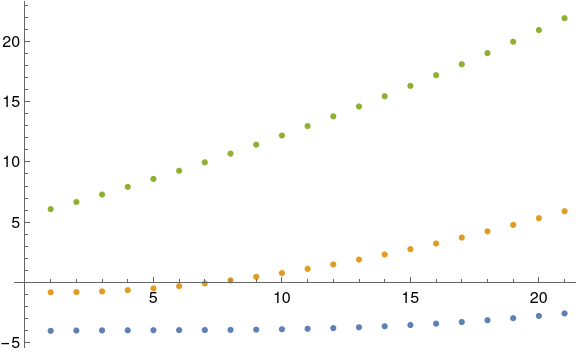
(Plot, though without scaling the x-axis)
ListPlot[Table[eValues, {\[Gamma], -1.0, 1.0, .1}] // Transpose]