Message Boards Message Boards

12
|
8652 Views
|
30 Replies
|
18 Total Likes
View groups...
Share
Share this post:

[WSG22] Daily Study Group: Introduction to Elementary Algebra

A Wolfram U daily study group introducing and exploring the basic concepts in algebra begins on September 26, 2022. In order to better accommodate students, this study group will meet at 3:00PM Central US time rather than the usual start time.

Join a cohort of fellow students in an enriching online community to learn algebra and prepare for further mathematics and statistics courses. This course starts with an explanation of the fundamental math operations and progresses to lessons on the order of operations, word problems, systems of equations and inequalities, polynomials and more. The study group also explores how the Wolfram Language can be used to help understand and reinforce algebraic problem-solving skills.

The Introduction to Elementary Algebra interactive course will soon be added to the Wolfram U catalog, and this Study Group offers early access to course lessons and resources, including the instructor (i.e. me)! This Study Group is aimed primarily at students, and the aforementioned meeting time reflects that. Moreover, no prior mathematics or Wolfram Language experience is required.

You can register here. I hope to see you there!

Wolfram U Banner

POSTED BY: Arben Kalziqi
30 Replies
Posted 1 year ago

In my Final Exam, in the question for Lesson 5, only the answer choices are visible.

In the question for Lesson 14, I believe that the correct answer is not offered.

In Lesson 28 problem, the solution for the question posed is not offered. However, the answer to a different question is there :-).

Help greatly appreciated. Be well,

POSTED BY: Heidi Liu

Hi Heidi—thanks for catching these issues! Because the final exam is generated on a per-person basis, I can't know which questions you're talking about. Would you mind sending these comments along with screenshots of the questions to wolfram-u@wolfram.com? Thank you!

POSTED BY: Arben Kalziqi
Posted 1 year ago

I have watched the Lesson 1: What is Algebra? video multiple times, but when I track my progress, it still shows I have not watched it. I want to request access to the final exam, but I'm not sure I can until I have received credit for watching the Lesson 1 video.

Has anyone else had the same issue?

POSTED BY: Jonathan Bell
Posted 1 year ago

Hi, having participated in the daily sessions, I am able to work on the quizzes and start the final. I have only watched a couple of videos, it seems to be of no consequence.

POSTED BY: Heidi Liu

Hi Jonathan—for Study Group participants, we'll automatically consider you to have watched all of the videos. Heidi is correct that this should not affect your ability to take the final exam.

POSTED BY: Arben Kalziqi

In the final exam for Lesson 14 and Lesson 28, none of the choices is correct.

POSTED BY: Rohit Namjoshi
Posted 1 year ago

Wonderful course, presenting the concepts along Wolfram language in a meaningful manner. Thank you!

POSTED BY: Heidi Liu

Thank you Heidi—I'm glad you enjoyed it!

POSTED BY: Arben Kalziqi
Posted 1 year ago

There is a typo in the Final Exam section of the online course. It says

Demonstrate your proficiency by becoming Wolfram Certified Level I in differential equations

POSTED BY: Updating Name

Quiz 4 - Question 2: I don't see a correct answer, don't agree with answer quiz is looking for.
Quiz 4 - Question 7: I do see a correct answer, don't agree with answer quiz is looking for. I may be missing something.

POSTED BY: Ray Chandler

Thanks Ray—we've fixed these bugs (and some others) in Quiz 4!

POSTED BY: Arben Kalziqi

Lesson 21, Slide 7 says: As you can see, the degree and the classification do not have anything to do with each other.

I don't believe that statement is true - degree must be >= number of terms -1.

degree of monomial >= 0; degree of binomial >= 1; degree of trinomial >= 2

degree of polynomial (with four or more terms) >= 3.

POSTED BY: Ray Chandler

Thanks for this comment, Ray—I was really only trying to say that the two numbers are not the same and don't have a direct relationship, but you're absolutely right that as stated, that's a misleading statement. I'll add this to my list of notebook updates that I'll be implementing in before the final course rollout.

POSTED BY: Arben Kalziqi

Typo in Lesson 26, Slide 7 - Factored form - one of x2's should be x1.

POSTED BY: Ray Chandler

Thanks for this correction also—I can update the video and the notebook.

POSTED BY: Arben Kalziqi

Hi;

In my attached notebook, I have 3 sinusoidal plots grouped together using GraphicsColumn[]. On the 3rd plot, I used Pi for my ticks. What I would like to do is eliminate the other ticks on plot 1 & 2 and instead use vertical dashed lines through all the plots where the sinusoidal crosses the x-axes of all 3 plots. Even after reading all the documentation, I still cannot figure out how to create the vertical dashed lines through all 3 plots.

Thanks,

Mitch Sandlin

Attachments:
POSTED BY: Mitchell Sandlin

Hi Mitch—are you trying to stack the 3 plots and put a vertical dashed line (or lines, in your case) that goes through all three of these plots, uninterrupted? I just want to check before I think of a possible solution. Here's what I have in mind currently:

GraphicsColumn[
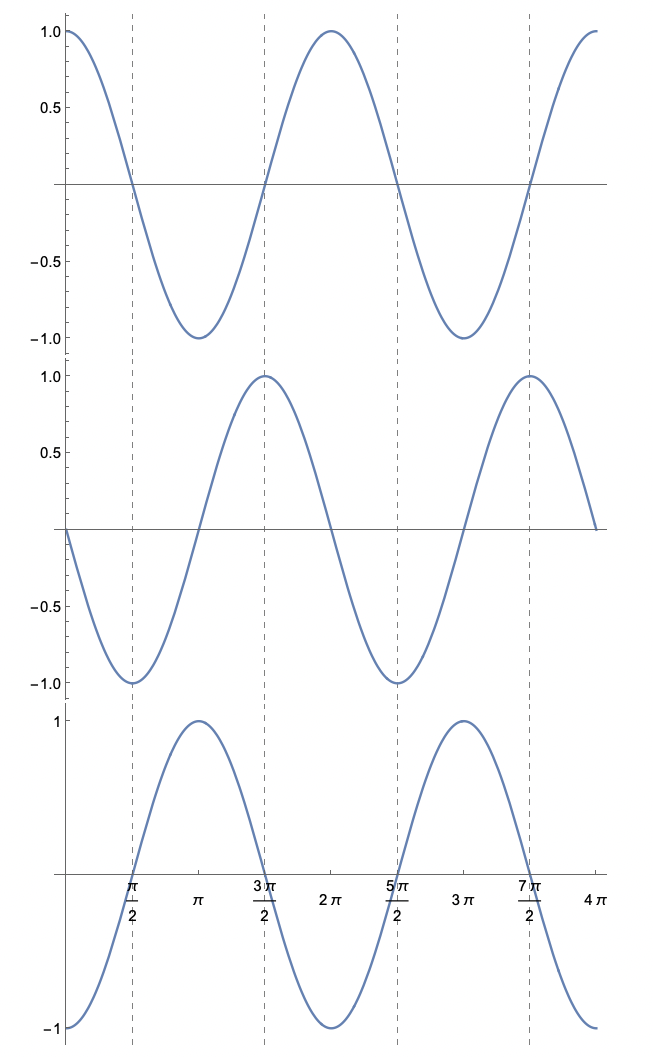
 {Plot[Cos[x], {x, 0, 4 \[Pi]}, Ticks -> {None, Automatic}, 
   GridLines -> {Range[\[Pi]/2, 9 \[Pi]/2, \[Pi]], None}, 
   GridLinesStyle -> Directive[Gray, Dashed]],
  Plot[-Sin[x], {x, 0, 4 \[Pi]}, Ticks -> {None, Automatic}, 
   GridLines -> {Range[\[Pi]/2, 9 \[Pi]/2, \[Pi]], None}, 
   GridLinesStyle -> Directive[Gray, Dashed]],
  Plot[-Cos[x], {x, 0, 4 \[Pi]}, 
   Ticks -> {Range[0, 4 \[Pi], \[Pi]/2], {-1, 1}}, 
   GridLines -> {Range[\[Pi]/2, 9 \[Pi]/2, \[Pi]], None}, 
   GridLinesStyle -> Directive[Gray, Dashed]]}, Spacings -> 0]

enter image description here

POSTED BY: Arben Kalziqi

Thanks so much, what you sent is really close to exactly what I wanted. After making a very few modifications to what you sent, I attempted to place points where the wave crossed the x-axes on the last plot and ran into a small problem - see attached notebook.

My plan was to make small points on the top plot where the points cross the x-axes (Rest Positions), medium sized points on the middle plot (Critical Points) and large points on the last plot (Inflection Points) with a legend at the bottom indicating what each sized plot represents. Part of the problem is that the x-axes is no longer at zero using GraphicsColumn[] and I am not sure how to determine the location of the points.

Incidentally, the way you used Range[] to distribute the Ticks across the plot was really neat.

Thanks,

Mitch Sandlin

Attachments:
POSTED BY: Mitchell Sandlin

Hi Mitch—I think I see what you mean. Let me know how the attached works.

I've just used an Epilogue in each plot because trying to find the exact overall coordinates in a stacked image like this is probably quite painful, as you've noticed. Otherwise, you might also consider using different colors for these points, just as one possibility.

POSTED BY: Arben Kalziqi

Hi Arben;

Thanks so much, that is exactly what I wanted on the stacked plots. By the way, you performed some really slick programming, I learned a lot.

Thanks Again, Mitch Sandlin

POSTED BY: Mitchell Sandlin

Thanks Mitch; I'm glad I was able to help! I tried to make the code efficient but readable rather than embracing my habit of making it more compact (which is certainly doable...).

POSTED BY: Arben Kalziqi
Posted 1 year ago

Greetings Arben!

Thanks for the great course! I'm enjoying it very much. Noticed a little typo in the Lesson 11 Systems of Linear Equations (Pre=DQA) notebook, slide 6, example 1

enter image description here

Cheers, -John

POSTED BY: John Tabbone

Thank you for the kind words and correction, John! I'll get that fixed.

POSTED BY: Arben Kalziqi

9-27-22 Great course. Am thrilled to be learning Wolfram Mathematica. Please also express my thankfulness to Dr. Wolfram. This is a great accomplishment for Humanity.

I could not find the exercises to practice on I was able to download all the lectures. Thanks Great course

Hi Paul—the exercises will be available once the course has been fully deployed via our Wolfram U MOOC framework. We're working on that, but in the meantime the extra exercises will not be available.

POSTED BY: Arben Kalziqi

Hi Arben;

Since I am working in degrees, I would like the output is degrees as well. However, Mathematica insists on giving my output in radians. In my example, I am adding two polar coordinates, with the first number in each coordinate is the magnitude and the second is the angle (in degrees). How is the best way to get my output in degrees?

Thanks,

Mitch Sandlin

ToPolarCoordinates[FromPolarCoordinates[{5, 36.87 °}] + FromPolarCoordinates[{10, -53.13 °}]]
POSTED BY: Mitchell Sandlin

Hi Mitch—this is certainly beyond the scope of this course, but I'll respond here given that I know the answer. Two things come to mind: the first is a bit trivial, but it works—simply multiply your result by {1,180 Degree/Pi. So for your code,

{1,180 Degree/Pi}*ToPolarCoordinates[FromPolarCoordinates[{5, 36.87 °}] + FromPolarCoordinates[{10, -53.13 °}]]

Alternatively, you could construct it like:

MapAt[180 Degree/Pi*#&,yourData,2]

This is nice in that it's extensible to a list of {r,theta} pairs just by doing:

MapAt[180 Degree/Pi*#&,yourData,{All,2}]

Hopefully that helps.

POSTED BY: Arben Kalziqi
Posted 1 year ago
toPolar[{x_, y_}] := ToPolarCoordinates[{x, y}] {1, \[Degree]^-1}

toCartesian[{r_, \[Theta]_}] := 
 FromPolarCoordinates[{r, \[Theta] \[Degree]}]
POSTED BY: Tomas Cane

Hi everybody—just noting that this study group is starting today at 3PM Central US time!

POSTED BY: Arben Kalziqi
Reply to this discussion
Community posts can be styled and formatted using the Markdown syntax.
Reply Preview
Attachments
Remove
or Discard

Group Abstract Group Abstract