Message Boards Message Boards

0
|
1279 Views
|
2 Replies
|
3 Total Likes
View groups...
Share
Share this post:

Colour gradient using a given function when plotting

Posted 1 year ago

Given a function, in this case reflecting risk as a function of depth, with 0 <= f(y) <= 1:

r [y_] := 1 - (y/100)^2

I wish to scale a colour gradient, along the lines of

risk = RegionPlot[r[y] <= 1, {x, -200, 200}, {y, 0, -100}, 
  ColorFunction -> "Rainbow"]

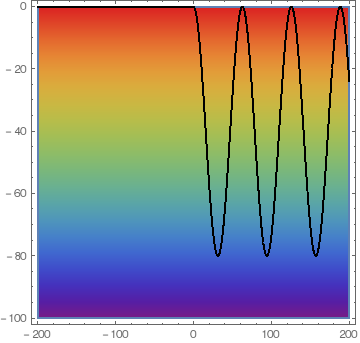
using the risk function (given above) i.e. red = high risk and blue = low risk with the rate of change of colour controlled by the function. Then add a legend in the form of a colour bar and associated values. This will form the background for various plots using different risk profiles.

The final plots will look something like:
simple sample

POSTED BY: Ted Bartlett
2 Replies
Posted 1 year ago

Thank you, it has certainly got me started. The final plot is pretty much what I am looking for (without the reversal).

POSTED BY: Ted Bartlett
Posted 1 year ago

POSTED BY: Eric Rimbey
Reply to this discussion
Community posts can be styled and formatted using the Markdown syntax.
Reply Preview
Attachments
Remove
or Discard

Group Abstract Group Abstract