What I think you want to do is set up a function that takes pH as an argument. Since H also depends on pH, I suggest you turn that into a function as well. So,
(* parameters *)
Ca = 0.1;
Cb = 0.1;
Ka = 1.75*10^-5;
Kb = 0.63;
Kw = 1.*10^-14;
Va = 10;

(* functions *)
H[pH_] := 10^-pH;
Vb[pH_] := Va*((Ca/(1 + H[pH]/Ka)) - H[pH] + Kw/H[pH])/((Cb/(1 + Kw/(H[pH]*Kb))) + H[pH] - Kw/H[pH])
A quick test:
Vb[11.9]
(* 11.8865 *)
Here is how you could generate some data for pH versus Vb:
Table[{x, Vb[x]}, {x, 3, 12.5, 0.2}]
Okay, now things change a bit. You said
My longer term goal is to use manipulate to illustrate the effects of changes to Ca, Cb, Ka, Kb and Va
Okay, so these other symbols aren't actually constants. So, you probably want to define Vb as a function of all of these arguments:
Vb[pH_, Ca_, Cb_, Ka_, Kb_, Kw_, Va_] :=
  Va*((Ca/(1 + H[pH]/Ka)) - H[pH] + Kw/H[pH])/((Cb/(1 + Kw/(H[pH]*Kb))) + H[pH] - Kw/H[pH])
You could replace H[pH] with the explicit expression 10^-pH. Now you can plug in whatever values you want:
Vb[11.9, 0.1, 0.1, 1.75*10^-5, 0.63, 1.*^-14, 10]
This should set you up for an easy Manipulate, but I don't know what ranges you want:
Manipulate[
 Vb[pH, Ca, Cb, Ka, Kb, Kw, Va],
 {pH, 3, 12.5},
 {Ca, < put bounds here >},
 {Cb, < put bounds here >},
 {Ka, < put bounds here >},
 {Kb, < put bounds here >},
 {Kw, < put bounds here >},
 {Va, < put bounds here >}]
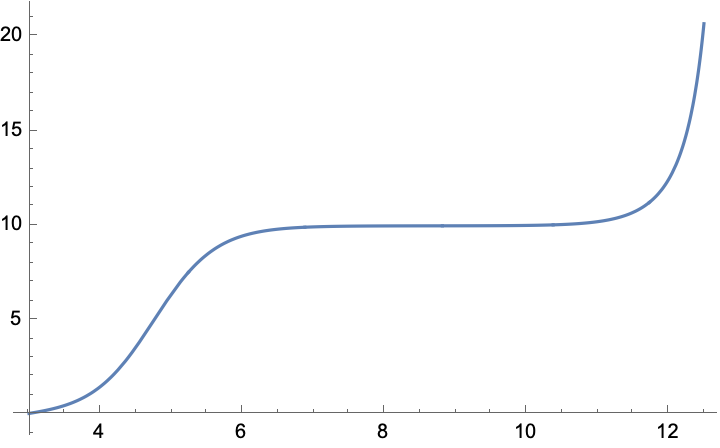
Oh, and here's a plot:
Plot[Vb[pH, 0.1, 0.1, 1.75*10^-5, 0.63, 1.*^-14, 10], {pH, 3, 12.5}]
