Message Boards Message Boards

How to connect with the WSMRealTimeSimulate?

Dear members of the community, In trying to make more interactive simulations, I looked into the functions WSMRealTimeSimulate and WSMRealTimePlot. I am using Wolfram Desktop. My code is like this.

s1 = SystemModel[
  "Modelica.Blocks.Sources.Sine", <|
   "ParameterValues" -> {"freqHz" -> 50.0, "amplitude" -> 0.5}|>];

To simply simulate a sinusoidal signal with frequency=50 Hz and an amplitude of 0.5. I also use the WSM link

Needs["WSMLink`"];

Then,

conn = WSMRealTimeSimulate[s1]

and to visualize the signal

WSMRealTimePlot[conn, "y", 0.1, PlotRange -> All]

The connection seems to work, but the viewed signal is always zero. I like to ask if someone may help with this. Simulating the block with the traditional SystemModelSimulate seems fine. Thanks in advance.

Jesus

4 Replies

Sergio,

That is great! Thank you very much.

Cheers,

Jesus

There is a variety of factors that affect the output WSMRealTimePlot, which could also be machine-dependent for high sampling frequencies. But there are a couple of options that allow you to have some control in real time simulation.

The first aspect to consider is that WSMRealTimeSimulate has the option RefreshRate which, to an extent, allows you to control the simulation communication rate (see the documentation page https://reference.wolfram.com/language/WSMLink/ref/WSMRealTimeSimulate.html

).

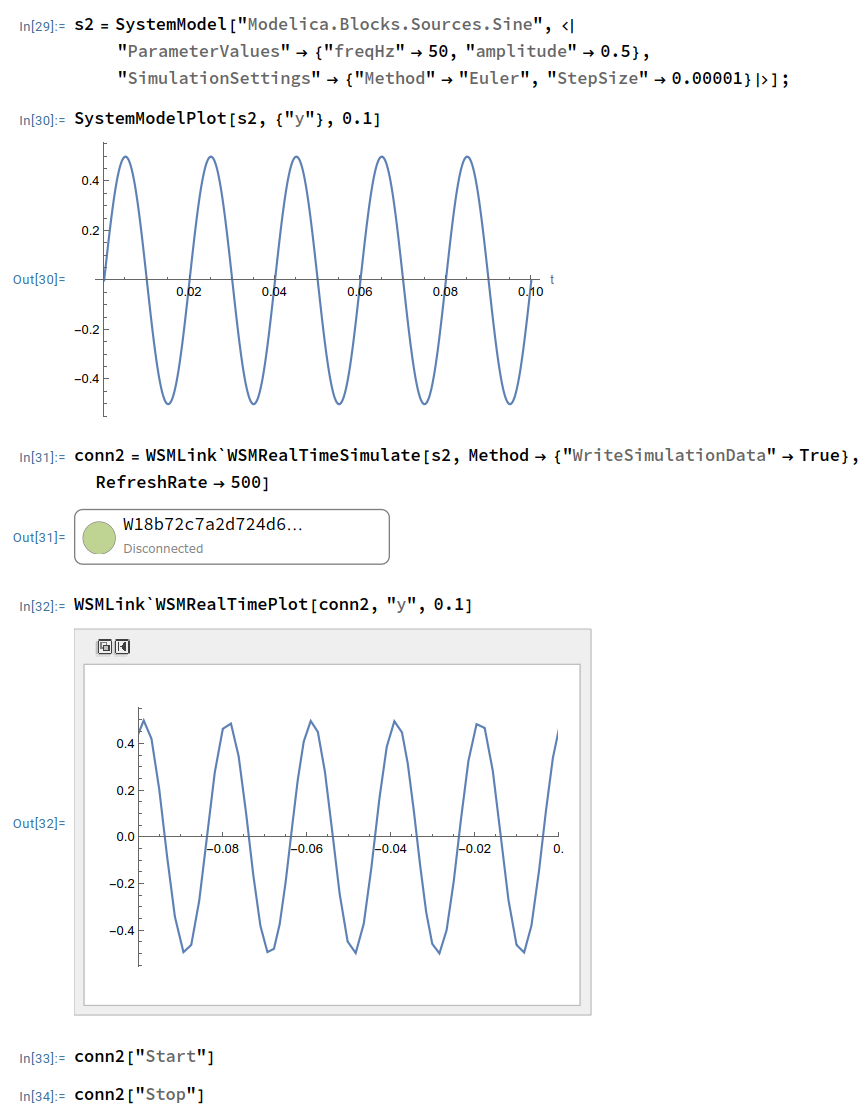
In addition, the simulation settings of the model itself can be chosen so that a small simulation step size is used togetether with an integration method that accepts a fixed step size. These are set with the "SimulationSettings" key in SystemModel.

Using these 2 in combination you can sample more effectively a frequency like the one you request.

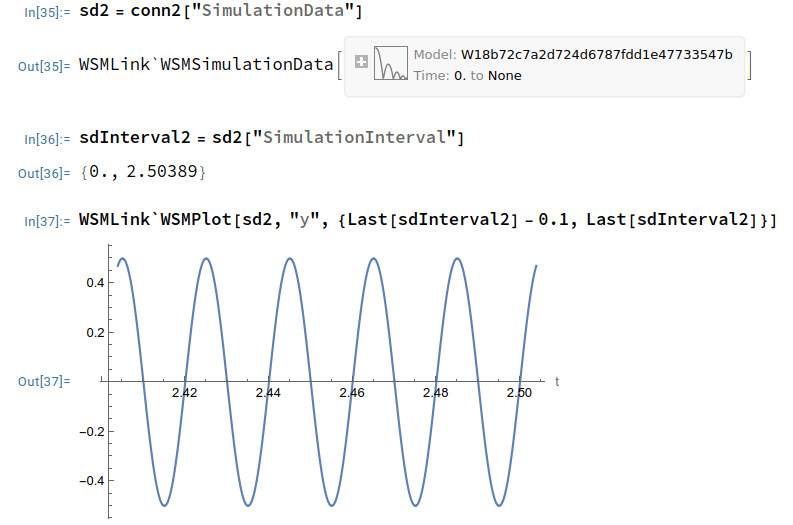
Finally, as I mentioned, the output of WSMRealTimePlot is tricky, in the sense that it will generally be an approximation of the actual simulation data. This you can check by, at the end of your simulation, extracting the simulation data and plotting the now static data, where you'll generally find a smoother signal.

Here you see all these factors playing together with your original model frequency and amplitude:

enter image description here

And here's what the actual static data looks like in those last 0.1 seconds:

enter image description here

POSTED BY: Sergio Vargas

Sergio, Thanks for your kind response. So, I guess now the important question will be, what is the shortest sample time WSMRealTimeSimulate can handle? A 50 Hz signal is a rather slow signal, I think. Cheers,

Jesus

Have you tried, as indicated in

https://reference.wolfram.com/language/WSMLink/ref/WSMRealTimePlot.html

to start the connection with

conn["Start"]

The sine in your model has a very high frequency, so the input changes very rapidly for your example, but a nicer output can be obtained if you use a lower frequency and an adjust time interval dt for WSMRealTimePlot, as in

enter image description here

POSTED BY: Sergio Vargas
Reply to this discussion
Community posts can be styled and formatted using the Markdown syntax.
Reply Preview
Attachments
Remove
or Discard

Group Abstract Group Abstract