Message Boards Message Boards

0
|
1565 Views
|
2 Replies
|
0 Total Likes
View groups...
Share
Share this post:

Plot legend data in ListStreamPlot

Posted 1 year ago

Hello, My main question is: what is the data that the legend bar shows in the ListSteramPlot?

I am trying to visualize a flow filed by ListSteramPlot. The magnitude of the velocity, I mean u^2+v^2 is between zero and one. But the data shown in the plot legend is from 0 to 500!

Attachments:
POSTED BY: Parvin Bayati
2 Replies
Posted 1 year ago

Hi, Thank you for your response. Here is my code.

flowdata = 
      Import["/Users/pmb5727/Projects/Drop_wall/flowData.dat", "Table"];
    Dimensions[flowdata]

    flowfield = 
      Partition[#, 2] & /@ 
       Table[{flowdata[[i, 1]], flowdata[[i, 2]], flowdata[[i, 3]], 
         flowdata[[i, 4]]}, {i, 1, Length[flowdata]}];
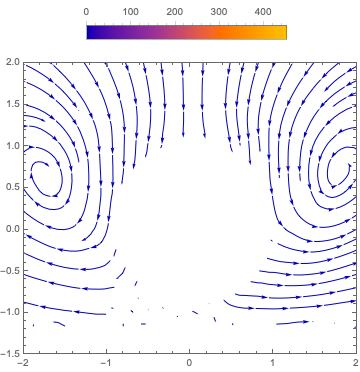
    ListStreamPlot[flowfield, PlotLegends -> Placed[Automatic, Above], 
     PlotRange -> {{-2.0, 2.0}, {-1.5, 2}}, AspectRatio -> 3.5/4]

enter image description here

POSTED BY: Parvin Bayati

Welcome to Wolfram Community! Please Edit your post and provide your Wolfram Language code. This will make it easier for other members to help you.

Check several methods available to include your code in the rules http://wolfr.am/READ-1ST

POSTED BY: EDITORIAL BOARD
Reply to this discussion
Community posts can be styled and formatted using the Markdown syntax.
Reply Preview
Attachments
Remove
or Discard

Group Abstract Group Abstract