Message Boards Message Boards

Cannot enlarge vertices of graph

Posted 1 year ago

Hello,

I created a program to generate a binary tree utilizing mathematicas DataStructure function. The graph being generated is too large to view in a notebook and be manipulated. I have successfully made the graph 'structure' somewhat viewable with the below function. However, this is very pixelated, and I cannot see the data that is actually contained within the vertices. You can see the graph in the attached PDF. It seems that the "Visualization" function is spitting out a graph data type, but I'm unable to use the graph options to make my vertices larger. You can see it in the below attached image. Nothing happens when I use the VertexSize option. I've attached my notebook with the data. What can I do to resize my graphs so they're not unreadable and pixelated? I need to see the data that is contained inside each vertice.

Graph[gameTree3["Visualization"], ImageSize -> {2550, 3300}]

enter image description here

POSTED BY: Ziggy Stardust
13 Replies

1., 2., and 3. can be accomplished using a VertexShapeFunction. I provided an example of this in an earlier answer. These requirements need a different implementation.

The helper function I provided in an earlier answer

ClearAll[visualizationToGraph];
visualizationToGraph[viz_, opts : OptionsPattern[Graph]] :=
  Graph[EdgeList[viz] /. ((VertexShapeFunction /. 
                Options[viz, VertexShapeFunction])[[1]])[[1, 1]], opts]

g = gameTree2["Visualization"];
g0 = visualizationToGraph[g];

VertexShapeFunction.

vsf[shape_, fontSize_, fontFamily_][position_, name_, dimensions_] :=
{EdgeForm[Black],
 White,
 shape[position],
 Text[Style[name, fontSize, Black, FontFamily -> fontFamily], position]};

shape is a function that takes a position and returns a Graphics primitive located at that position. E.g.

shape1 = Disk[#1, .2] &;
shape2 = RegularPolygon[#, .25, 6] &;
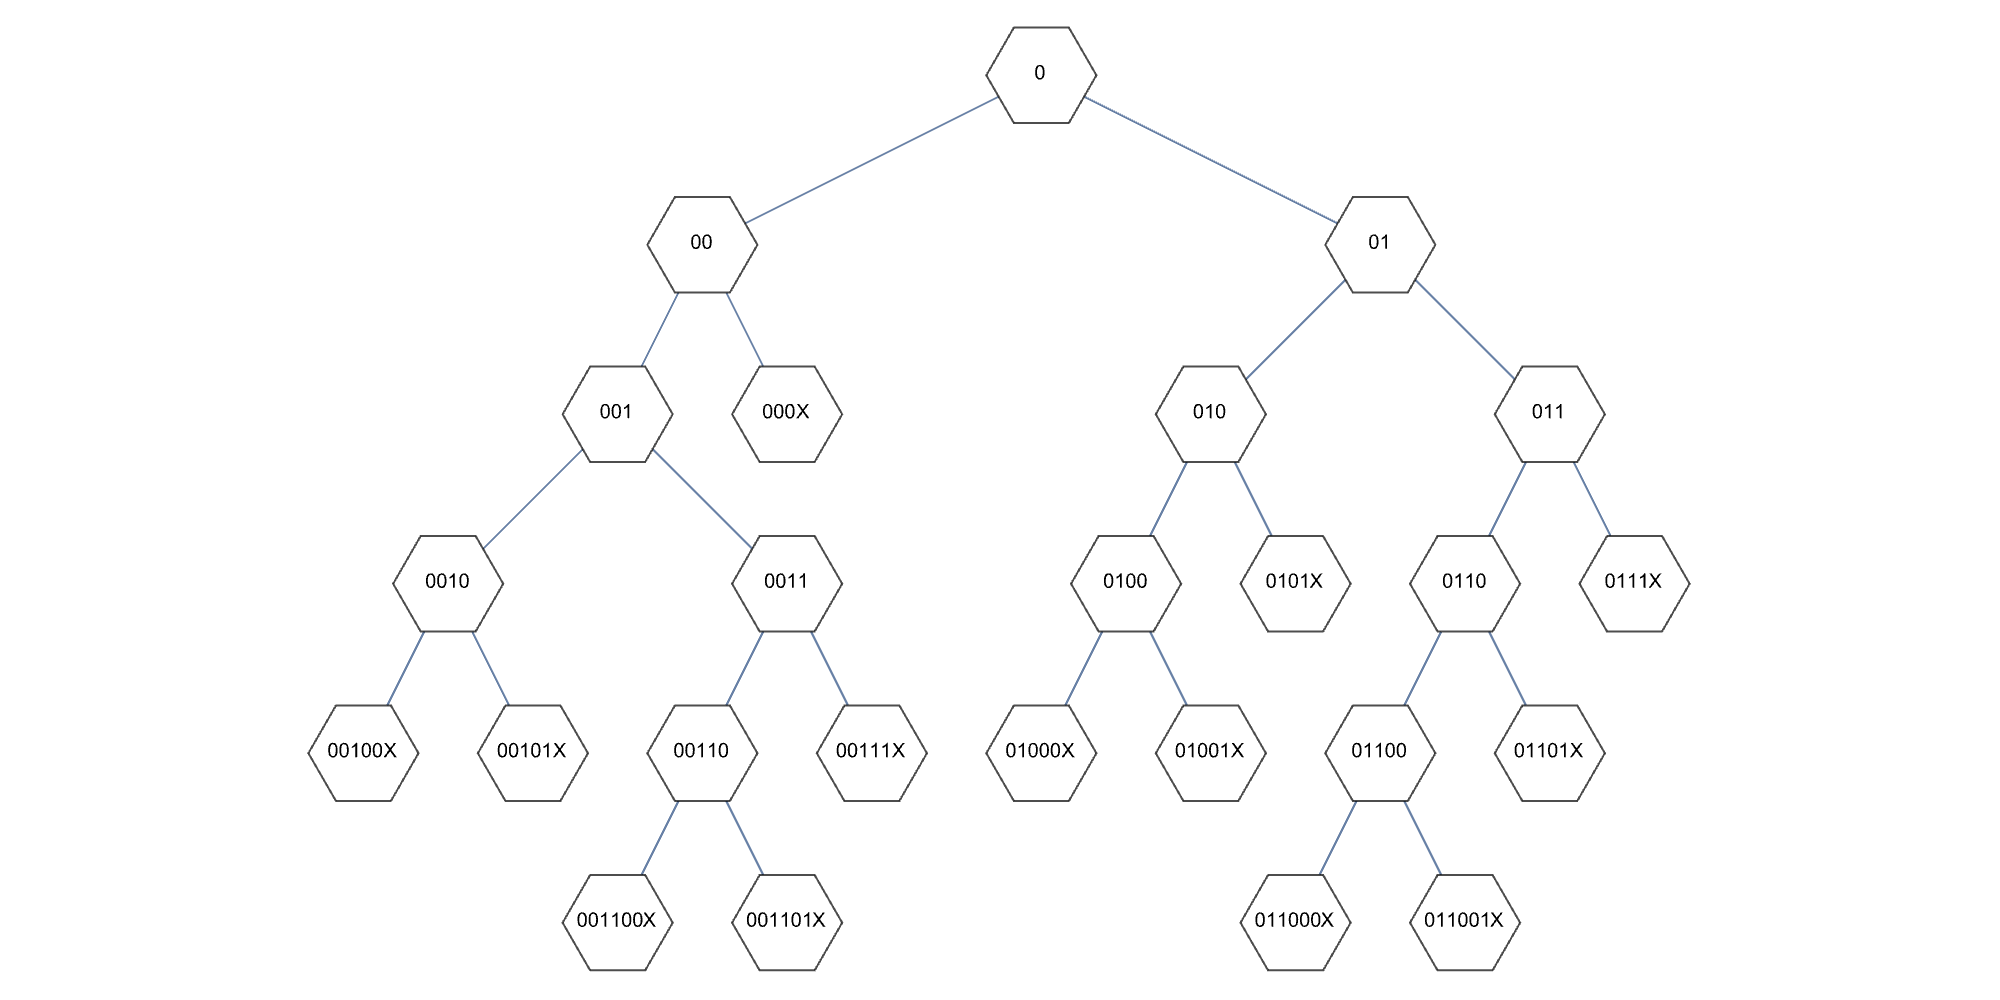
Using shape2

g1 = Graph[g0,
  VertexShapeFunction -> vsf[shape2, 10, "Arial"],
  ImageSize -> {1000, 500},
  PerformanceGoal -> "Quality"]

enter image description here

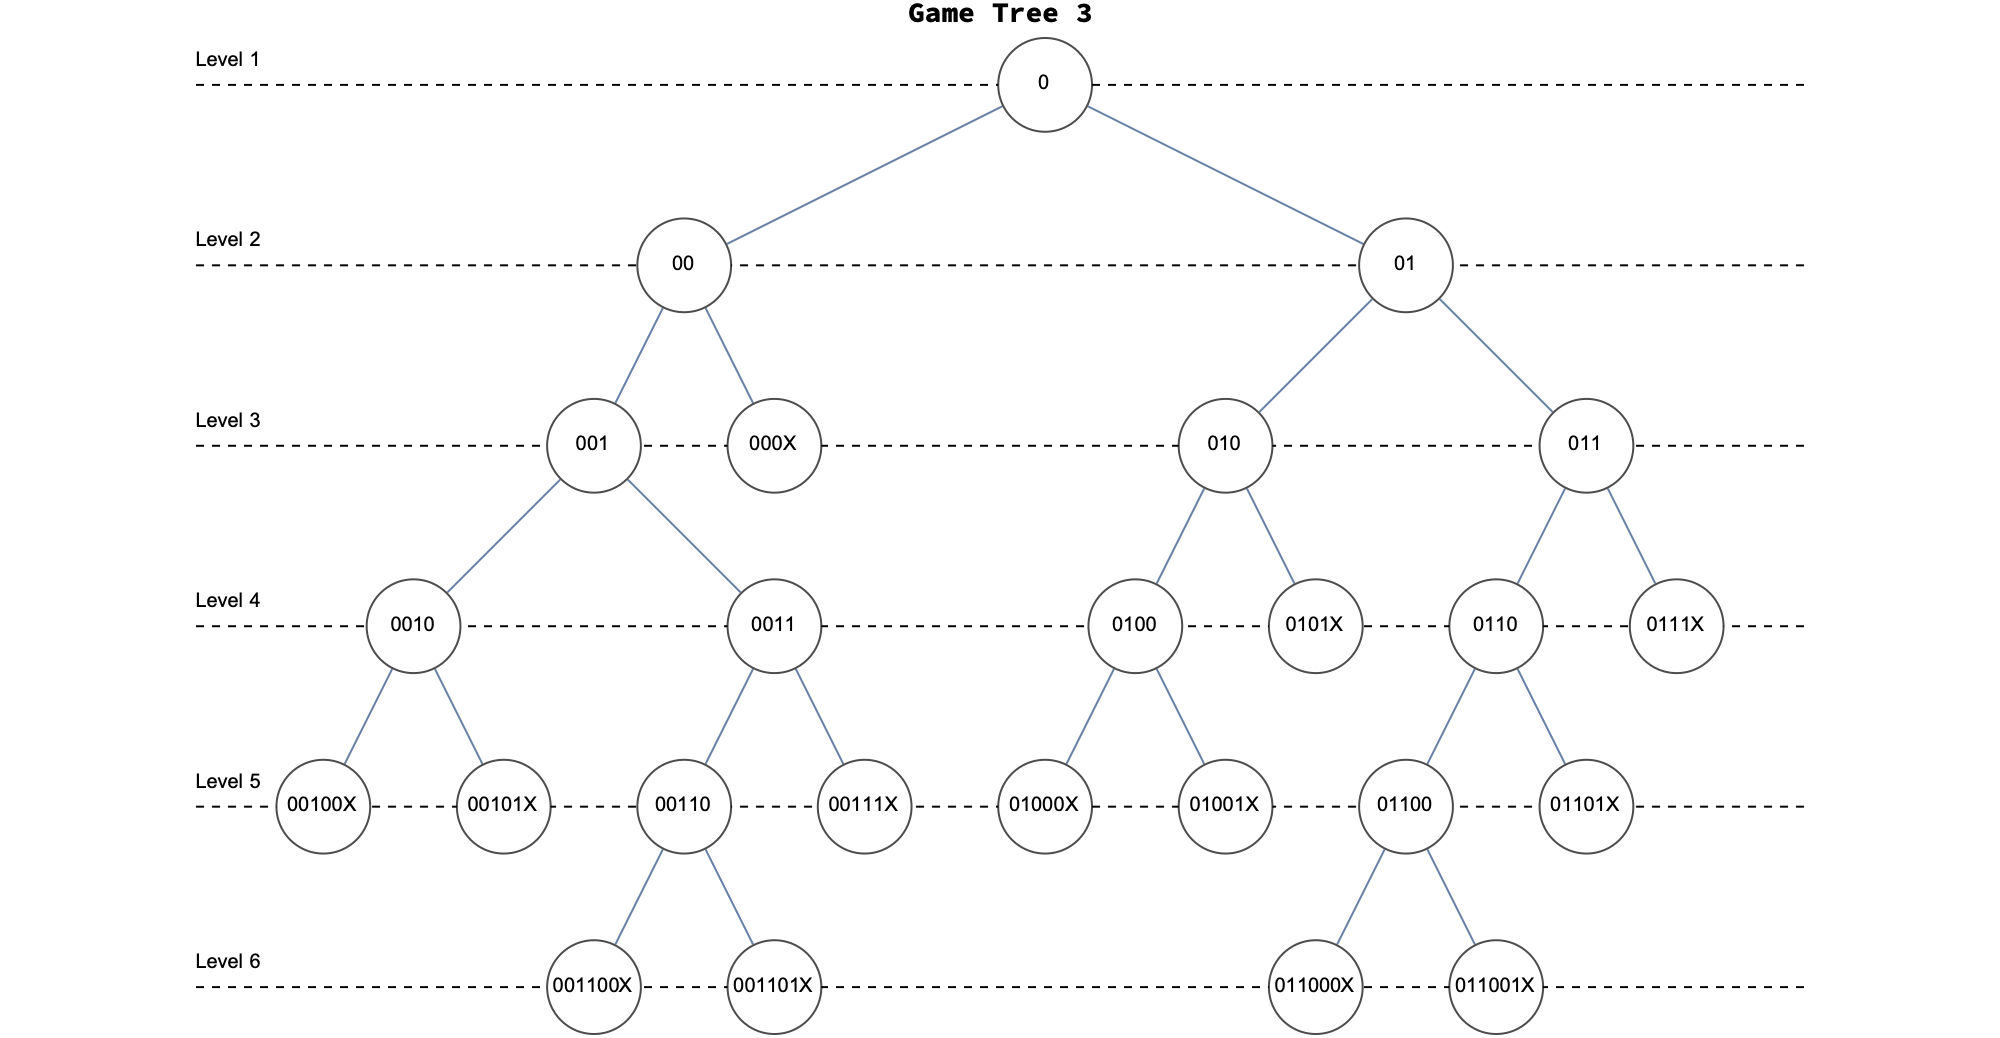
The requirements for 4. are not very clear. Here is one interpretation

g2 = Graph[g0,
   VertexShapeFunction -> vsf[shape1, 10, "Arial"],
   ImageSize -> {1000, 500},
   PerformanceGoal -> "Quality"];
yPositions = GraphEmbedding[g2][[All, 2]] // DeleteDuplicates;
prolog = 
  MapThread[{Text["Level " <> ToString@#2, {-.4, #1 + .1}], Dashed, InfiniteLine[{{0, #1}, {1, #1}}]} &,
   {ReverseSort@yPositions, Range@Length@yPositions}];

GraphPlot[g2,
   PlotRangePadding -> {Scaled[.05], 0},
   Prolog -> prolog] // 
 Labeled[#, Style["Game Tree 3", 14, Black, Bold], Top] &

enter image description here

POSTED BY: Rohit Namjoshi
Posted 1 year ago

Thank you very much for working on this. I finally had some time to come back and look at your response. This is exactly what I needed. The final product needs to be a fairly large image. I was able to edit what you posted to increase the image and font size, but I can't seem to figure out how to increase the thickness of the dashed line. How can that be done to make everything look proportionate?

g2 = Graph[g0, VertexShapeFunction -> vsf[shape1, 44, "Arial"], 
   ImageSize -> {3840, 2160}, PerformanceGoal -> "Quality", 
   EdgeStyle -> 
    Black(*edge color*)]; 
yPositions = GraphEmbedding[g2][[All, 2]] // DeleteDuplicates;
prolog = 
  MapThread[{Style[Text["Level " <> ToString@#2, {-.4, #1 + .1}], 
      FontSize -> 44(*font size of the Level *)], Dashed, 
     InfiniteLine[{{0, #1}, {1, #1}}],(*font size of the letters \
inside the circles*)} &, {ReverseSort@yPositions, 
    Range@Length@yPositions}];

GraphPlot[g2, PlotRangePadding -> {Scaled[.05], 0}, Prolog -> prolog]
POSTED BY: Updating Name

You can add e.g. Thickness[0.2] before Dashed, however, this just increases the vertical size of the dashes which may not look good. You will have to experiment with a combination of Dashing (rather than Dashed) and Thickness to make it to look right.. e.g. Dashing[{.02, .02}], Thickness[.02]

POSTED BY: Rohit Namjoshi

Thank you that worked. See below.

g2 = Graph[g0, VertexShapeFunction -> vsf[shape1, 44, "Arial"], 
   ImageSize -> {3840, 2160}, PerformanceGoal -> "Quality", 
   EdgeStyle -> 
    Black(*edge color*)]; (*This changes the style of the graph*)
yPositions = GraphEmbedding[g2][[All, 2]] // DeleteDuplicates;
prolog = 
  MapThread[{Style[Text["Level " <> ToString@#2, {-.4, #1 + .1}], 
      FontSize -> 44(*font size of the Level *)], Dashing[{.02, .01}],
      Thickness[.001], 
     InfiniteLine[{{0, #1}, {1, #1}}],(*font size of the letters \
inside the circles*)} &, {ReverseSort@yPositions, 
    Range@Length@yPositions}];

GraphPlot[g2, PlotRangePadding -> {Scaled[.05], 0}, Prolog -> prolog]

enter image description here

POSTED BY: Ziggy Stardust

Hello,

I've attached a notebook file with what I'm currently trying to do, and thank you all for putting together these response's. They have been tremendously helpful. I've moved onto playing around with a simpler graph using these functions. I need to change a few things to conform with the style of my document. I was able to increase the text size and play around with the positioning of the labels; however, I'm having trouble with some other changes.

I'm trying to do numerous things.

  1. I only want to see the black outline of the circle without any fill.
  2. I also need the text to be in Arial font. (Tried using LabelStyle -> {FontFamily -> "Arial"} but it doesn't appear to be working.
  3. How do I change the size and/or shape of the vertices?
  4. Is there anyway to add horizontal lines that would indicate the height of the tree? (With some simple label centered in-between the horizontal lines on the left or right.)

Help with any of this would be much appreciated!

Thank you

POSTED BY: Ziggy Stardust
Posted 1 year ago

Would this do the job, even if it's a bit hacky and no longer looks much like a tree?

g = gameTree3["Visualization"];
Graph[EdgeList[
   g] /. ((VertexShapeFunction /. 
       Options[g, VertexShapeFunction])[[1]])[[1, 1]], 
 VertexLabels -> "Name", ImageSize -> 2000]

It's basically extracting the edges and vertex labels from your binary tree, then recreating the Graph with vertex labels displayed and all of it enlarged for easier reading.

Side note: InputForm of g helped me figure out what to look for.

POSTED BY: Peter Fleck

Hi Peter,

Nice!. To make it look a little more like Ziggy's plot

vsf[width_, fontSize_][position_, name_, dimensions_] := 
  Inset[Framed[
    Pane[Style[name, fontSize, Black], width, Alignment -> Center],
    Background -> LightYellow,
    RoundingRadius -> 5], position];

g3g = Graph[
   DirectedEdge @@@ EdgeList[g] /. ((VertexShapeFunction /. Options[g, VertexShapeFunction])[[1]])[[1, 1]],
   VertexLabels -> "Name",
   ImageSize -> 2000];

Graph[g3g,
 VertexShapeFunction -> vsf[25, 8],
 VertexLabels -> None,
 EdgeStyle -> Arrowheads[.005],
 GraphLayout -> {"LayeredEmbedding", "RootVertex" -> "0", "LeafDistance" -> .4},
 PerformanceGoal -> "Quality"]

enter image description here

Have to experiment with the values passed to vsf, GraphLayout, AspectRatio, ImageSize to get a better separation between the vertices.

POSTED BY: Rohit Namjoshi

Ahh. Okay, Thank you! I see that you used Graph to change the appearance. So, this is now a valid graph object? Thank you for sharing this. Can you recommend any of Graphs built in functions to find out more information about the tree?

POSTED BY: Ziggy Stardust

Can you recommend any of Graphs built in functions to find out more information about the tree?

There are several Graph algorithms that you could use depending on what question(s) you are trying to answer. Take a look at this guide page. Since the graph is a tree it can be converted to a Tree using GraphTree.

g4 = gameTree4["Visualization"];
g4g = visualizationToGraph[g4];
g4t = Graph[DirectedEdge @@@ EdgeList[g4g]] // GraphTree[#, "0"] &;

TreeLeafCount@g4t
(* 3941 *)

TreeCount[g4t, _?(StringStartsQ[#, "0111"] &)]
(* 1121 *)

TreeDepth[g4t]
(* 19 *)

TreeDepth[g4t, "0111101100100"]
(* 12 *)

Take a look at this guide page for details.

POSTED BY: Rohit Namjoshi

Hello, Thank you! I was able to get a much better image. The function GraphQ[] also is saying it's a valid graph object. It's now a lot easier to visualize. Can I now use g4 and g3 with all the functionality that is given in the Graph documentation?

In[7]:= g = gameTree4["Visualization"]; 
g4 = Graph[EdgeList[g] /. ((VertexShapeFunction /.Options[g, VertexShapeFunction])[[1]])[[1, 1]], VertexLabels -> "Name", ImageSize -> 2000];

In[9]:= GraphQ[g4]

Out[9]= True

In[12]:= g = gameTree4["Visualization"]; 
g3 = Graph[EdgeList[g] /. ((VertexShapeFunction /.Options[g, VertexShapeFunction])[[1]])[[1, 1]], VertexLabels -> "Name", ImageSize -> 2000];

In[14]:= GraphQ[g3]

Out[14]= True

Here is the n = 3 enter image description here

Here is the n = 4

enter image description here

POSTED BY: Ziggy Stardust

Can I now use g4 and g3 with all the functionality that is given in the Graph documentation?

Yes, you can. Here is a little helper function that encapsulates extracting the graph data from the visualization (from Peter's answer) and constructing a usable Graph from it. It accepts all of the options that Graph supports. E.g.

ClearAll[visualizationToGraph];
visualizationToGraph[viz_, opts : OptionsPattern[Graph]] :=
 Graph[EdgeList[viz] /. ((VertexShapeFunction /. 
        Options[viz, VertexShapeFunction])[[1]])[[1, 1]], opts]

g4 = gameTree4["Visualization"];
visualizationToGraph[g4,
 GraphLayout -> "SpringElectricalEmbedding",
 VertexLabels -> Placed["Name", Tooltip], (* Use a Tooltip to display the vertex name *)
 VertexStyle -> Red,
 ImageSize -> 1000]

enter image description here

POSTED BY: Rohit Namjoshi

We simulated a game within a binary tree and utilized the function CreateDataStructure, which seems to output a DataStructure object that is not workable. What can I do to change this into a usable graph object?

POSTED BY: Ziggy Stardust

Hi Ziggy

It seems that the "Visualization" function is spitting out a graph data type, but I'm unable to use the graph options to make my vertices larger

The reason for this is that the Graph returned does not have the usual structure, take a look at its InputForm. The VertexShapeFunction refers to the undocumented DataStructure`Visualization`RenderVertex function. That can be overridden by e.g.

Graph[gameTree3["Visualization"], VertexShapeFunction -> "Circle"]

But the data associated with each node is lost. Since Graph is an Atom there is no easy way to extract the data.

Is there a reason for using DataStructure rather than Graph to build the tree?

POSTED BY: Rohit Namjoshi
Reply to this discussion
Community posts can be styled and formatted using the Markdown syntax.
Reply Preview
Attachments
Remove
or Discard

Group Abstract Group Abstract