Message Boards Message Boards

Glider Launching DE equation solving

Posted 1 year ago
у0 = 2174;(*meter*)
V0 = 159;(*meters / sec*)
theta0 = 0;(* initial pitch *)
mL = .0011;
mD = .0001;
g = 9.8;
solutions = NDSolve[ {v '[t] == -g * Sin[theta[t]] - mD * v[t] ^2, v[t] * theta ' [t] == -g * Cos[ theta[t]] +mL *v[t]^2, v[0] == V0, theta[0] ==theta0}, {v[t], theta[t]}, {t, 0, 120}];
speed[ t_] = v[t] /. solutions[[1]][[1]];
angle[ t_] = theta[t] /. solutions[[1]][[2]];

PositionSol = NDSolve[ {x '[t] == speed[t] * Cos[angle[t]], y '[t] == speed[t] * Sin[angle[t]], x[0] == 0, y(0) == y0}, {x[t], y[t]}, {t, 0, 120}];
xP[t_] = x[t] /.PositionSol[[1]][[1]];
yP[t_] = y[t] /.PositionSol[[1]][[2]];

Plotting Speed and Angle;
Plot[speed[t], {t, 0, 120}, PlotRange -> All]
Plot[angle[t] * (180 / Pi), {t, 0, 120}, PlotRange -> All]
Plot[xP[t],{t, 0, 120}] 
Plot[yP[t],{t, 0, 120}]

I'm trying to plot vertical and horizontal distance against time, but the graph is not displayed. I'm new to Wolfram; kindly help!

POSTED BY: Said Hafidh
3 Replies
Posted 1 year ago

Thank you so much for your reply.these are my set of equations the code successfully plotted for angle'[t] and speed'[t] but the x[t], and y[t] are not displayed.

POSTED BY: Said Hafidh

Ok, I missed the first part of the code in your question. It was not formatted correctly and there were some syntax errors.

y0 = 2174; V0 = 159; theta0 = 0; mL = .0011; mD = .0001; g = 9.8;
solutions = 
 NDSolve[{v'[t] == -g*Sin[theta[t]] - mD*v[t]^2, 
   v[t]*theta'[t] == -g*Cos[theta[t]] + mL*v[t]^2, v[0] == V0, 
   theta[0] == theta0}, {v[t], theta[t]}, {t, 0, 120}]

speed[t_] = v[t] /. solutions[[1]][[1]]
angle[t_] = theta[t] /. solutions[[1]][[2]]

sol = 
 NDSolve[{x'[t] == speed[t]*Cos[angle[t]], 
   y'[t] == speed[t]*Sin[angle[t]], x[0] == 0, y[0] == y0}, {x[t], 
   y[t]}, {t, 0, 120}]

xP[t_] = x[t] /. sol[[1]][[1]];
yP[t_] = y[t] /. sol[[1]][[2]];

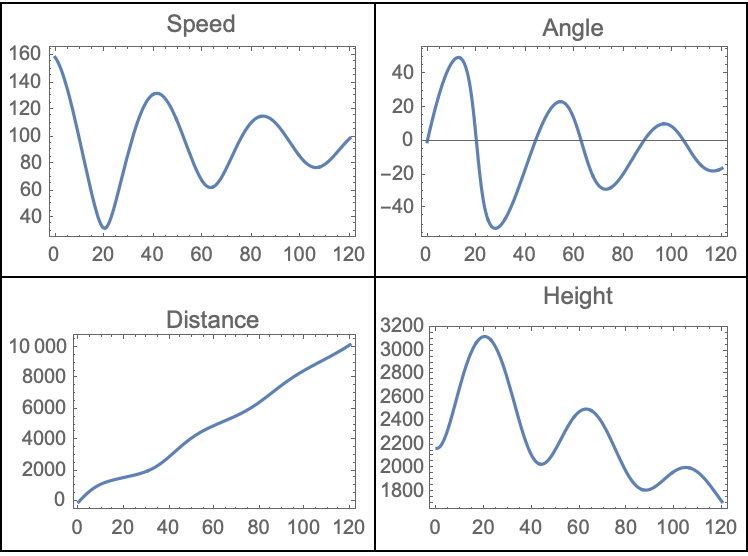
{Plot[speed[t], {t, 0, 120}, PlotRange -> All, PlotLabel -> "Speed", Frame -> True],
 Plot[angle[t]*(180/Pi), {t, 0, 120}, PlotRange -> All, PlotLabel -> "Angle", Frame -> True],
 Plot[xP[t], {t, 0, 120}, PlotRange -> All, PlotLabel -> "Distance",Frame -> True],
 Plot[yP[t], {t, 0, 120}, PlotRange -> All, PlotLabel -> "Height", Frame -> True]} //
Partition[#, UpTo@2] & // 
Grid[#, Frame -> All, Alignment -> Bottom] &

enter image description here

POSTED BY: Rohit Namjoshi

There are four dependent variables angle[t], speed[t], x[t], and y[t] but only two equations. You need to specify equations for angle'[t] and speed'[t]. There is a Wolfram Demonstrations Project on the Flight of a Glider that might help.

POSTED BY: Rohit Namjoshi
Reply to this discussion
Community posts can be styled and formatted using the Markdown syntax.
Reply Preview
Attachments
Remove
or Discard

Group Abstract Group Abstract