I am new to this programming language and want to run the following set of code to make a region 3D plot of surface structure based on the contour data points as per the image shown below. For this, I am taking the point for the contour, inner surface, and background and assigning it to the set so variable. but the code is showing an error as Syntax::sntxi: Incomplete expression; more input is needed.
imag =![Contour][1];
wid = ImageDimensions[imag][[1]];
len = ImageDimensions[imag][[2]];
t = 1;
For[i = 1, i <= wid, i++,
 For[j = 1, j <= len, j++, p[i, j] = PixelValue[imag, {i, j}][[1]];
  If[p[i, j] == 1, {x1[t] = i; x2[t] = j; t++}]]]
t = t - 1;

imag =![Inner Surface][2];
wid = ImageDimensions[imag][[1]];
len = ImageDimensions[imag][[2]];
pt = 1;
For[i = 1, i <= wid, i++,
 For[j = 1, j <= len, j++, p[i, j] = PixelValue[imag, {i, j}][[1]];
  If[p[i, j] == 1, {px1[pt] = i; px2[pt] = j; pt++}]]]
pt = pt - 1;

imag =![Background][3];
wid = ImageDimensions[imag][[1]];
len = ImageDimensions[imag][[2]];
gt = 1;
For[i = 1, i <= wid, i++,
 For[j = 1, j <= len, j++, p[i, j] = PixelValue[imag, {i, j}][[1]];
  If[p[i, j] == 1, {gx1[gt] = i; gx2[gt] = j; gt++}]]]
gt = gt - 1;


k = 0.01;
RegionPlot3D[
 (Cos[0.2 x] Cos[0.2 y] Cos[0.2 z] -
      Sin[0.2 x] Sin[0.2 y] Sin[0.2 z] + 0.1) (
\!\(\*UnderscriptBox[
OverscriptBox[\(\[Sum]\), \(t\)], \(i = 1\)]\)
      Exp[-k ((x - x1[i])^2 + (y - x2[i])^2)]) + (Cos[0.2 x] Sin[
        0.2 y] + Cos[0.2 y] Sin[0.2 z] + Cos[0.2 z] Sin[0.2 x] -
      0.59) (
\!\(\*UnderscriptBox[
OverscriptBox[\(\[Sum]\), \(pt\)], \(i = 1\)]\)
      Exp[-k ((x - px1[i])^2 + (y - px2[i])^2)]) - (
\!\(\*UnderscriptBox[
OverscriptBox[\(\[Sum]\), \(gt\)], \(i = 1\)]\)
     Exp[-k ((x - gx1[i])^2 + (y - gx2[i])^2)]) >= 0, {x, 0, wid}, {y,
   0, len}, {z, 0, 100}, PlotRange -> All, Mesh -> False,
 Axes -> False, Boxed -> False, PlotPoints -> 50,
 PlotStyle -> Directive[Specularity[White, 1], Opacity[1], Blue],
 BoxRatios -> Automatic]
I wanted an output as follow : 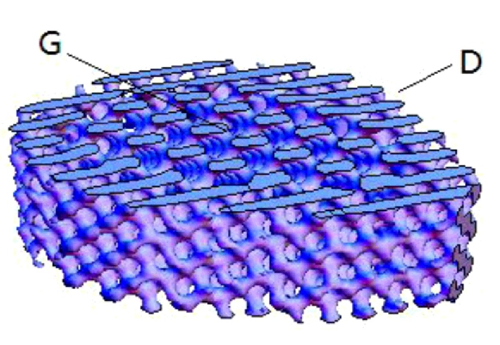
Please help me identify the problem...


