Message Boards Message Boards

0
|
1733 Views
|
4 Replies
|
4 Total Likes
View groups...
Share
Share this post:

Parabolic coordinates (surfaces and coordinate lines)

Posted 1 year ago

How to plot the parabolic coordinates,

{x=u v Cos[\[Theta]], y=u v Sin[\[Theta]], z=1/2 (u^2 - v^2)}, 
{u \[GreaterSlantEqual] 0, v \[GreaterSlantEqual] 0, 0 \
\[LessSlantEqual] \[Theta] < 2 \[Pi]},

as rotation paraboloid. Tried ContourPlot3D, but failed.

POSTED BY: Bernd Wichmann
4 Replies

Bernd,

I do not have any experience with parabolic coordinates, but after having seen this mathworld-page this might points into the right direction:

RevolutionPlot3D[{{x, 1/2 (1 - x^2)}, {x, -(1/2) (1 - x^2)}}, {x, 0, 1.5}, {\[Theta], 0, 2 Pi}, ImageSize -> Large]

enter image description here

Regards -- Henrik

POSTED BY: Henrik Schachner

Henrik thanks - this looks fine.

Grüße nach Bayern

Bernd

POSTED BY: Bernd Wichmann

Bernd,

maybe this what you are looking for:

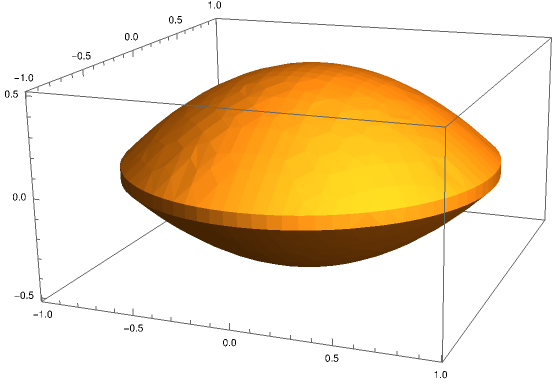
reg = ParametricRegion[{{u v Cos[\[Theta]], u v Sin[\[Theta]], 1/2 (u^2 - v^2)}, 
    0 < u < 1 && 0 < v < 1 && 0 < \[Theta] < 2 Pi}, {u, v, \[Theta]}];

RegionPlot3D[reg, Axes -> True, PlotPoints -> 30, ImageSize -> Large]

enter image description here

Regards to Austria -- Henrik

POSTED BY: Henrik Schachner

Henrik, thank you very much for your proposal. Wolfram MathWorld https://mathworld.wolfram.com/ParabolicCoordinates.html shows in 2-dimensional, where parabolic coordinates are best understood, the course of the coordinate lines. I would like to plot two paraboloid of rotation around the z-axis e.g. u=1, v=1.

POSTED BY: Bernd Wichmann
Reply to this discussion
Community posts can be styled and formatted using the Markdown syntax.
Reply Preview
Attachments
Remove
or Discard

Group Abstract Group Abstract