Message Boards Message Boards

1
|
2401 Views
|
6 Replies
|
11 Total Likes
View groups...
Share
Share this post:

Adding a best fit surface

Posted 1 year ago

A very elementary presentation question for a new user - I have a 3D point plot to which I am attempting to add a "best-fit" surface. Tediously I cannot seem to get even the simplest of trials to work (i.e. I can generate the plot easily enough (trivial sample attached) but adding this surface is beyond me. I'm undertaking to learn Wolfram Language as a senior citizen, but better late than never I say.
enter image description here

POSTED BY: Geoff Booth
6 Replies

Geoff,

Tediously I cannot seem to get even the simplest of trials to work ...

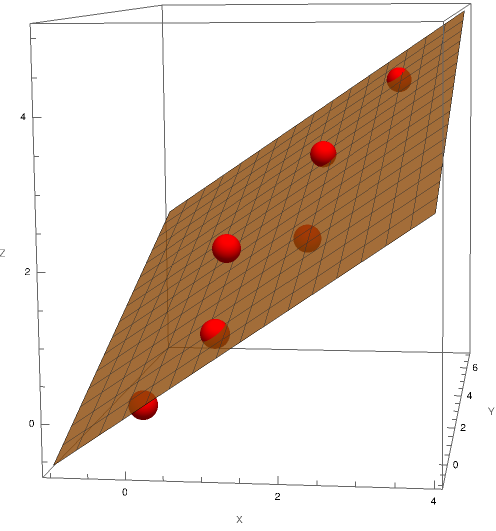
To me, this task does not seem that simple! By "best-fit surface" you probably want a plane. If so one can try to fit a two dimensional linear function:

pts = {{0, 0, 0}, {1, 0, 1}, {1, 1, 2}, {2, 2, 2}, {2, 4, 3}, {3, 6, 4}};
model = a x + b y + c;
params = FindFit[pts, model, {a, b, c}, {x, y}];
ptGrph = Graphics3D[{Red, Sphere[pts, .2]}];
Show[Plot3D[Evaluate[model /. params], {x, -1, 4}, {y, -1, 7}, 
  PlotStyle -> Opacity[.8], BoxRatios -> Automatic, 
  AxesLabel -> {"X", "Y", "Z"}, ImageSize -> Large], ptGrph]

enter image description here

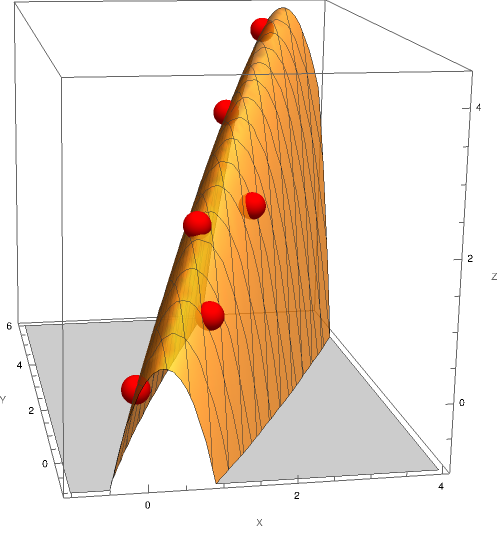
In case you require that all points lie exactly on the surface then I would suggest using an InterpolatingPolynomial:

ipp = InterpolatingPolynomial[{Most[#], Last[#]} & /@ pts, {x, y}];
Show[Plot3D[ipp, {x, -1, 4}, {y, -1, 6}, PlotStyle -> Opacity[.8], 
  BoxRatios -> Automatic, AxesLabel -> {"X", "Y", "Z"}, 
  ImageSize -> Large, PlotRange -> {-1, Automatic}], ptGrph]

enter image description here

I'm undertaking to learn Wolfram Language as a senior citizen, but better late than never I say.

Congrats! I can only strongly encourage you to do so! Regards -- Henrik

POSTED BY: Henrik Schachner
Posted 1 year ago

POSTED BY: Jari Kirma

I propose another fitting function, which attempts to minimize true distance to the plane.

Yes - that is definitely the better approach! Thanks for sharing!

POSTED BY: Henrik Schachner
Posted 1 year ago

Probably so if the coordinates are truly geometric and they are measured in same units on orthogonal axes; otherwise minimising Euclidean distances is likely to only worsen the situation... :)

That is, if x and y coordinates are temperature and rainfall and z is crop yield your method is likely to be more useful, and correct.

Also, if coordinates are measured in some other way than straight axes, with same units, which are at right angle with each other, data is going to need adjustment so that those requirements are met.

POSTED BY: Jari Kirma
Posted 1 year ago

Many thanks for everyone's help and encouragement - I started using APL in the 1970's and have come full circle to "symbolic" language but am alas, feeling my way. This is enormously helpful.

Many many thanks.

GB

POSTED BY: Geoff Booth

Welcome to Wolfram Community! Please make sure you know the rules: https://wolfr.am/READ-1ST

The rules explain how to format your code properly. Posting code Images doesn't help other members to copy your code. Please EDIT your post and make sure code blocks start on a new paragraph and look framed and colored like this.

int = Integrate[1/(x^3 - 1), x];
Map[Framed, int, Infinity]

You can also embed notebook or attach notebook.

enter image description here

POSTED BY: Moderation Team
Reply to this discussion
Community posts can be styled and formatted using the Markdown syntax.
Reply Preview
Attachments
Remove
or Discard

Group Abstract Group Abstract