Here is somethin misterious:
h = TransferFunctionModel[1/s, s]]
result =
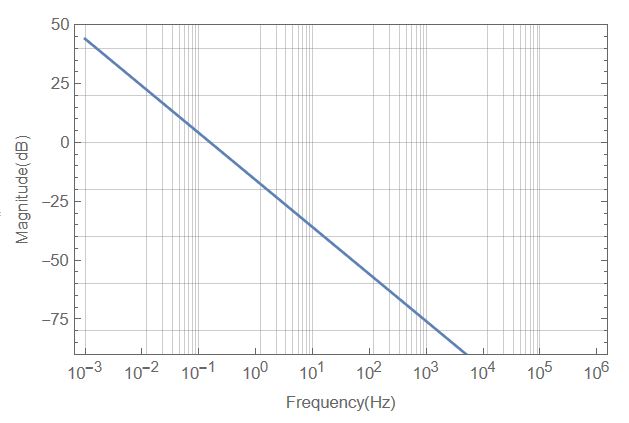
BodePlot[h[I*2*\[Pi]*freq], {freq, 10^-3, 10^6},
PlotRange -> {{-90, 50}}, PlotLayout -> "Magnitude",
ScalingFunctions -> {"Log10", "dB"},
FrameLabel -> {HoldForm[Text[Frequency[Hz]]],
HoldForm[Text[Magnitude[dB]]]}, GridLines -> Automatic,
PlotStyle -> Thickness[0.005],
FrameTicks -> {{Automatic,
Automatic}, {Table[{10^i, Superscript[10, i]}, {i, -3, 6}],
None}}];
points1 = Cases[result, Line[data_] :> data, Infinity][[1]];
FirstGraphPlotPoints1 =
Transpose[
Join[{10^Transpose[points1][[1]]}, {Transpose[points1][[2]]}]];
Export["C:\\Desktop\\FirstGraphPlotPoints1.xlsx", \
FirstGraphPlotPoints1]
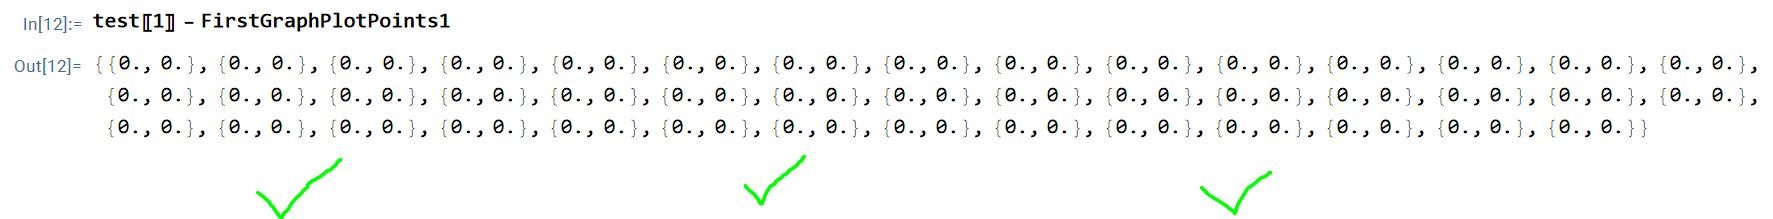
test = Import["C:\\Desktop\\FirstGraphPlotPoints1.xlsx"];
test[[1]] - FirstGraphPlotPoints1
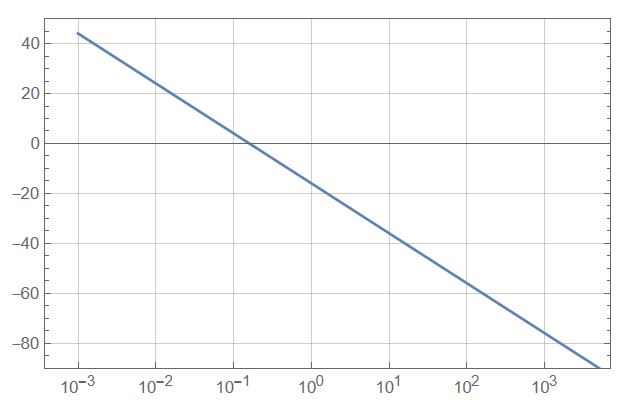
ListLogLinearPlot[FirstGraphPlotPoints1, Joined -> True,
 GridLines -> Automatic, Frame -> True,
 PlotRange -> {{Automatic, Automatic}, {-90, 50}},
 FrameTicks -> {{Automatic,
    Automatic}, {Table[{10^i, Superscript[10, i]}, {i, -3, 6}],
    None}}]
result
They're the same, but when I put them together:
Show[result, ListLogLinearPlot[FirstGraphPlotPoints1, Joined -> True]]
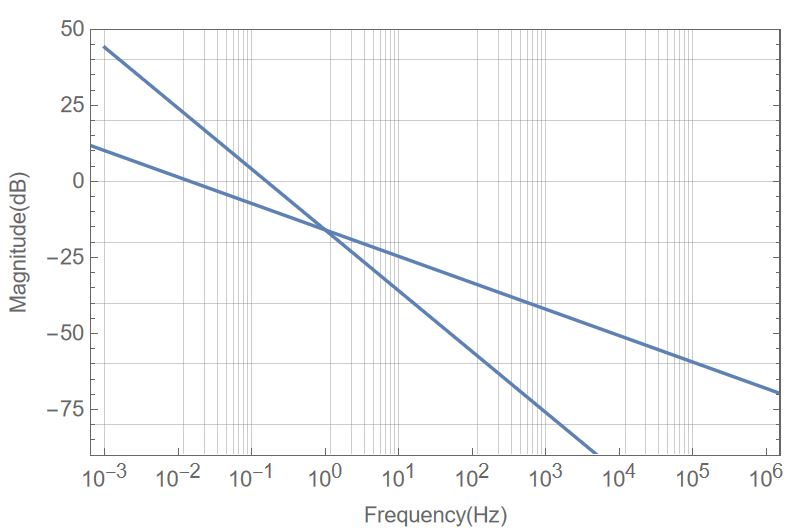
Something mysterious happens when I put the 2 graphs together. Individually they are identical (you can look at the 2 graphs individually), but together they no longer seem identical. There is a problem with this show function. What do you think that happens here at show function?
Mathematica 13.2 Notebook file attached.
 Attachments:


