Message Boards Message Boards

GeoElevationData yields dataset with reversed north-south axis

Posted 1 year ago

I've been working through the Elementary Introduction to the Wolfram Langauge book on the Wolfram website. Chapter 24, on "More Forms of Visualization" has an example of using ListPlot3D with &[GeoElevationData][1] to yield a 3-dimensional view of Mount Everest.

I wanted to try that code on examples that were more familiar to me. But it seems that the QuantityArray that is generated reverses the north-south axis. I tried it on a several locations with similar results. See attached notebook for a couple of them. As a visual comparison, I referred to https://mapcarta.com for the same locations.

I can fix it by using ScalingFunctions -> "Reverse" as an option to ListPlot3D. But I shouldn't have to. I guess the elevation data is stored in the array in a reversed order.

POSTED BY: Glen Deering
2 Replies
Posted 1 year ago

Thanks, Jose! It's just another reminder to refer to the documentation when something doesn't look right.

POSTED BY: Glen Deering

Indeed, a reversal of the first level of the data is needed in ListPlot3D. The documentation page of GeoElevationData uses the construction ListPlot3D[Reversed[data], ...] in its examples. This is a question of conventions used, and we always have to take into consideration which convention is being used by each function. Take for instance this data:

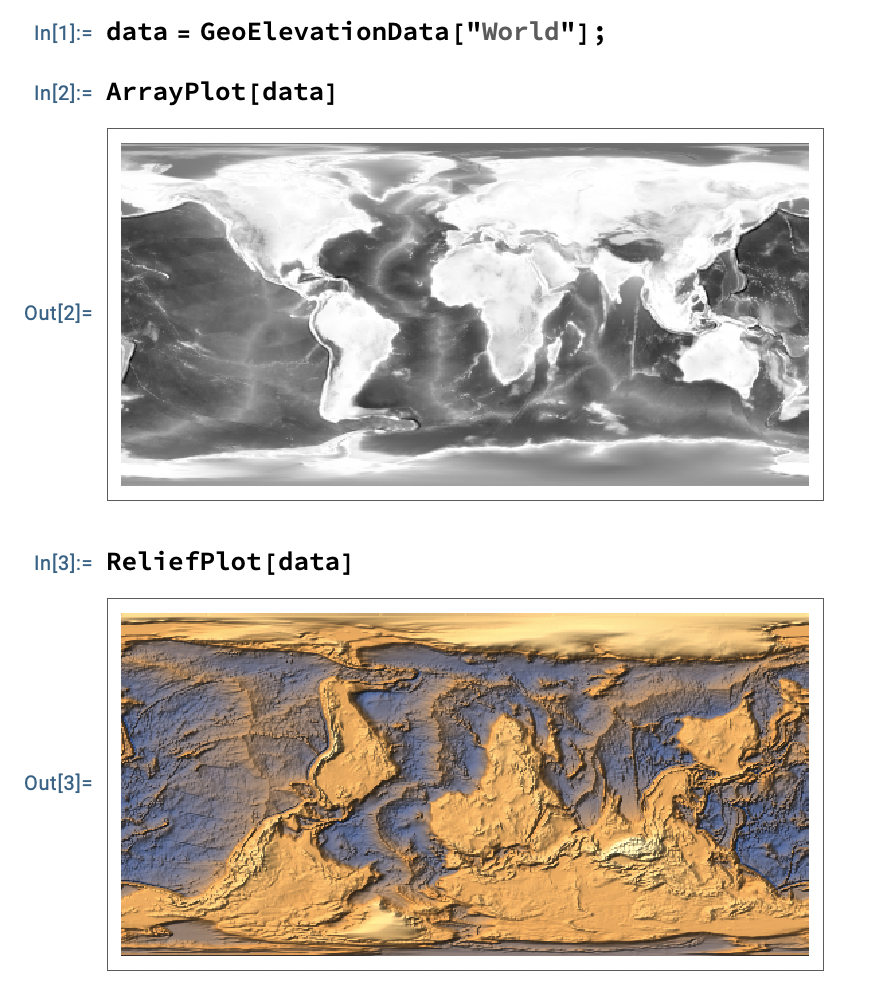
data = GeoElevationData["World"];

and compare the results of these two:

ArrayPlot[data]
ReliefPlot[data]

We see that different functions interpret the data differently, and we may need to reverse the data (with Reverse, or the option DataReversed, or the ScalingFunctions value "Reverse" as you did).

enter image description here

Reply to this discussion
Community posts can be styled and formatted using the Markdown syntax.
Reply Preview
Attachments
Remove
or Discard

Group Abstract Group Abstract