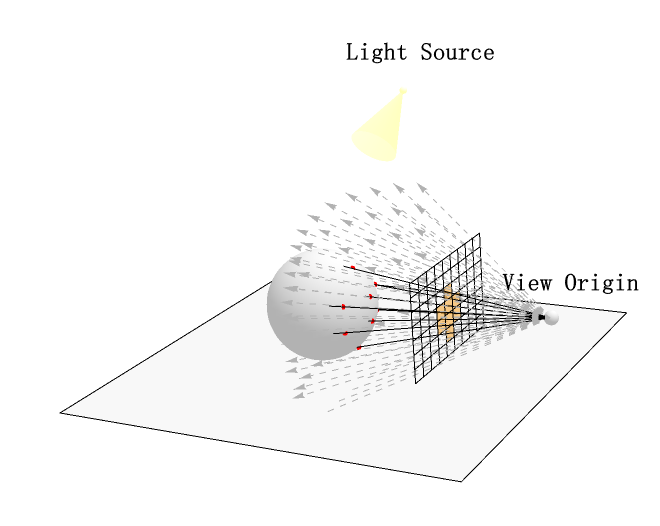
I am trying to create some 3D objects in Mathematica that have a similar style to the ones in the official documentation. For example: Below are some graphs on the "Physically Based Rendering" chapter (Those graphs are pretty neat). 
I have tried using various functions in Mathematica, such as ParametricPlot3D, Graphics3D, and RegionPlot3D, but have not been able to achieve the desired style.
I would appreciate any advice or guidance on creating similar style graphs.
----- update
Finally got some time to work on this. Below is my implementation, it's a bit verbose and tedious especially when visualizing complex scenes. So I'm here to seeking a better way to accomplish this.
DynamicModule[{
  MakeHPlane, MakeVPlane, MakeVGrids,
  LightPos = {-1.0, 0, 4}, Object = Sphere[ {0.5, 0, 0.8}, 0.8],
  ViewPos = {-3, 0, 1},
  FrontPlanePos = {-2, 0, 0},
  GetRay,
  ViewGrids,
  ViewRays,
  ViewGridsFilled,
  RaySphereIntersections,
  LengthenRay,
  PostProcRay,
  PostProcGrid
  },(*Right hand, Z up, CW?*)
 LengthenRay[a_, b_, t_] :=
  Module[{n = Normalize[b - a], l = Length[b - a]},
   {a, a + n l t}
   ];

 RaySphereIntersections[p1_, p2_, sphere_] :=
  RegionIntersection[sphere, Line[{p1, p2}]];
 MakeHPlane[origin_, extent_] :=
  (origin + # * extent) & /@ {{-1, -1, 0}, {1, -1, 0}, {1, 1, 0}, {-1,
      1, 0}};
 MakeVPlane[origin_, extent_] :=
  (origin + # * extent) & /@ {{0, -1, -1}, {0, 1, -1}, {0, 1,
     1}, {0, -1, 1}};
 MakeVGrids[c_, r_, plane_] := Module[{
    bounds ,
    range,
    part = {c, r},
    increment
    },
   bounds = List @@ BoundingRegion[plane];
   range = Abs /@ Subtract @@ bounds;
   increment = {range[[2]]/part[[1]], range[[3]]/part[[2]]};

   Table[
    MakeVPlane[{ bounds[[1]][[1]], i, j}, {0, increment[[1]]/2,
      increment[[2]]/2}], {i, bounds[[1]][[2]], bounds[[2]][[2]],
     increment[[1]]}, {j, bounds[[1]][[3]], bounds[[2]][[3]],
     increment[[2]]}]
   ];
 ViewGrids =
  MakeVGrids[8, 6, MakeVPlane[{-1.5, 0, 1.0},  {0, 1, 0.6}]] //
   ArrayReshape[#, {Times @@ Dimensions[#]/12, 4, 3}] &;
 GetRay[p_] :=
  LengthenRay[ViewPos, Midpoint[List @@ BoundingRegion@p], 1.2];
 ViewRays = (p |-> Arrow[GetRay[p]]) /@ ViewGrids;
 PostProcRay[ray_] := Module[{p1, p2, intersection},
   {p1, p2} = (List @@ ray)[[1]];
   intersection = RaySphereIntersections[p1, p2, Object];

   If[RegionDimension@intersection >= 0, {GrayLevel[0],
     Dashing[None], ray, Red, intersection}, {GrayLevel[0.7],
     Dashing[0.01], ray}]
   ];
 (*performance ? *)
 PostProcGrid[grid_] := Module[{p1, p2, intersection},
   {p1, p2} = GetRay[grid];
   intersection = RaySphereIntersections[p1, p2, Object];
   If[RegionDimension@intersection >= 0, {Opacity[0.5],
      Glow[RGBColor[0.97, 0.606, 0.081]],
      FaceForm[GrayLevel[0]]}, {EdgeForm[GrayLevel[0]],
      FaceForm[None, None]}]~Join~{Polygon@grid}
   ];
 Graphics3D[{
   Text[Style["Light Source", "Text", FontWeight -> Bold,
     FontFamily -> "SimSun", FontSize -> 12], LightPos + {-.3, 0, .5}],
   Text[Style["View Origin", "Text", FontWeight -> Bold,
     FontFamily -> "SimSun", FontSize -> 12],
    ViewPos + {-.3, 0, .5}],
   Object,
   Sphere[ViewPos, .1],
   Polygon[MakeHPlane[{0, 0, 0},  3]],(* ground plane*)
   {Glow[Orange], Sphere[LightPos, 0.05]},
   {Glow[Yellow], EdgeForm[None], Opacity[.8],
    Cone[{{-.5, 0.0, 3.2}, LightPos}, 1/3]},
   (*Polygon[MakeVPlane[{-1.5,0,1},  {0, 2, 1}]],*)
   PostProcGrid /@ ViewGrids,

   Arrowheads[Small],
   PostProcRay /@ ViewRays
   },
  Boxed -> False,
  Lighting -> {{"Directional", GrayLevel[0.3], LightPos}, {"Ambient",
     GrayLevel[0.7]}}
  ]
 ]