Hi, I would like to plot the 3x-y-z=2, x+2y-3Z=-12 and 2X+y+3z=9 in the same page, what's the command I should use?
I tried the following but all failed. Please advise.
Plot 3x-y-z=2, x+2y-3Z=-12 and 2X+y+3z=9
Plot {3x-y-z=2, x+2y-3Z=-12 and 2X+y+3z=9}
Plot3D 3x-y-z=2, x+2y-3Z=-12 and 2X+y+3z=9
Plot3D {3x-y-z=2, x+2y-3Z=-12 and 2X+y+3z=9}
Thank you both very much!
You need to change the equations into explicit functions: z=3x-y-2, z=x/3+2y/3+4 and z=-2x/3-y/3 Then use Plot3D as following:
Another way to plot a implicit region is to use RegionPlot or RegionPlot3D. But you can't plot a real plane without thickness. So you need to change it a little and plot more points like below.
But there is a better option is ContourPlot3D.
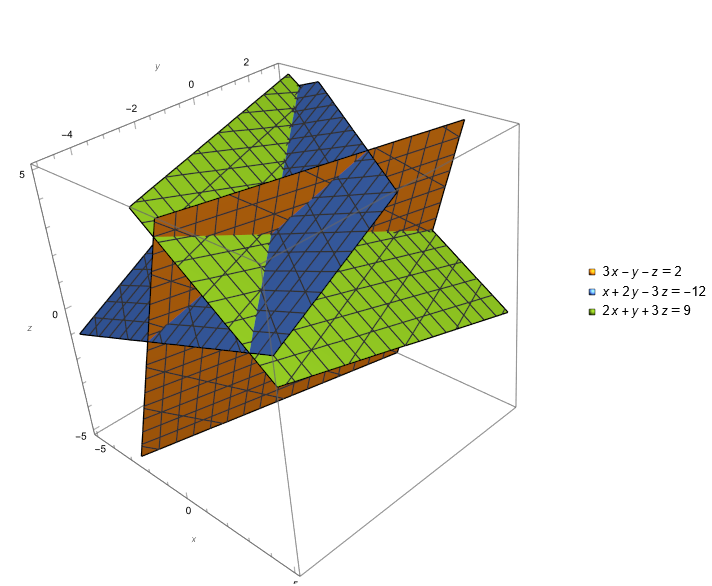
Here is one way:
ContourPlot3D[{3 x - y - z == 2, x + 2 y - 3 z == -12, 2 x + y + 3 z == 9}, {x, -5, 5}, {y, -5, 3}, {z, -5, 5},
 PlotLegends -> "Expressions", ImageSize -> Large, AxesLabel -> Automatic]