Message Boards Message Boards

0
|
1804 Views
|
2 Replies
|
1 Total Likes
View groups...
Share
Share this post:

MatrixPlot not functioning properly for higher 2D dimensions

Posted 1 year ago

Hi For Some reason I am having problems with MatrixPlot .

I am using matrixPlot to plot matrices using 1 and 2's , in the {8,22) , {32,9}, {87,10}, {176 ,11) dimensions range ..

The Plot works fine but when I get to the {11,76} dimension it corrupts {instead of using 2 colours it is using 3, even though the matrix is still in 1's and 2's. I attach a notebook to illistate the difference between the MatrixPlot of dimensions {87,10}, and {176 ,11)

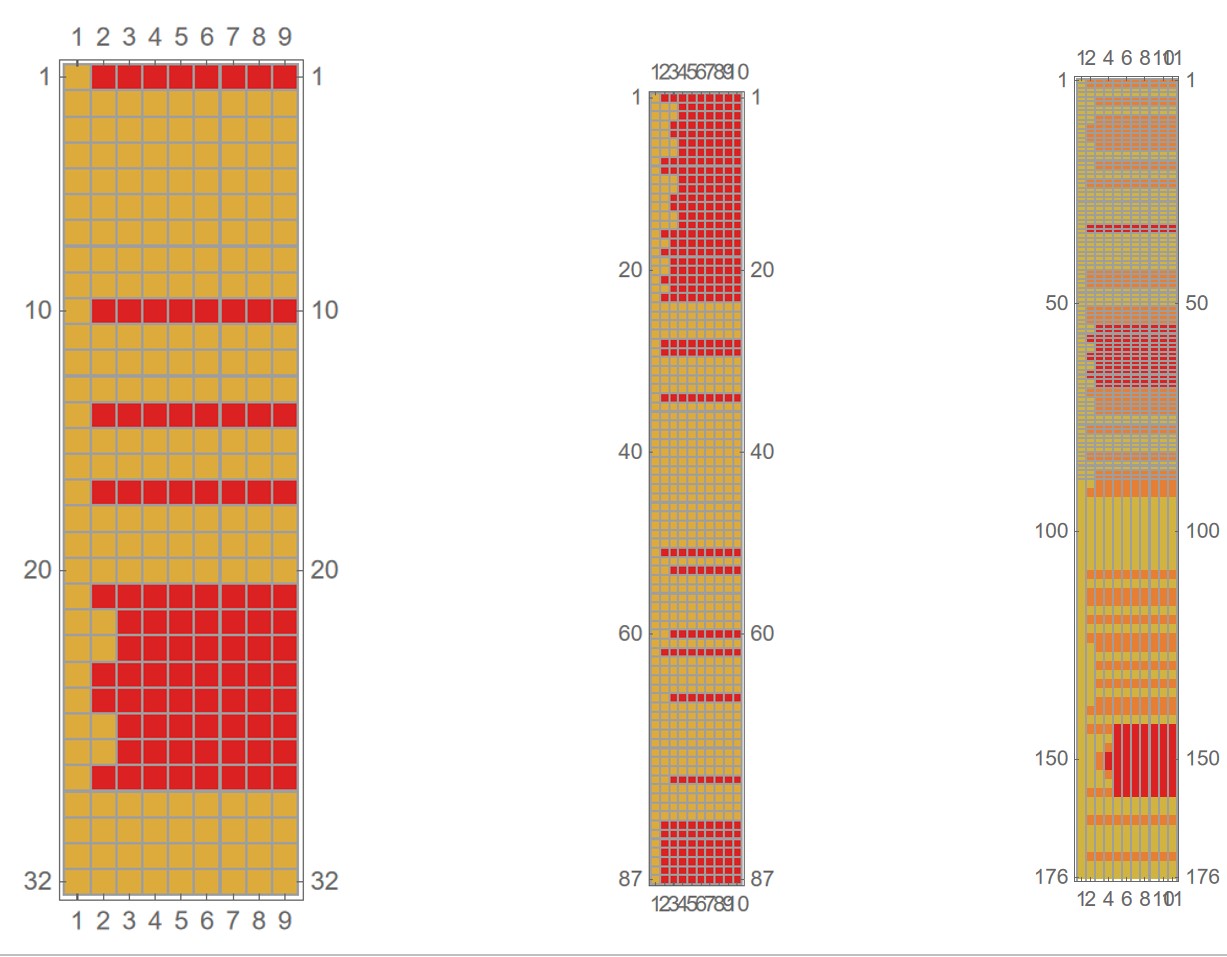
The Output for MatrixPlot's of {32,9}, {87,10}, {176 ,11)

enter image description here

POSTED BY: Doug Beveridge
2 Replies

Ref guide page fourth bullet item in Details: "With the default setting MaxPlotPoints->Automatic, sufficiently large or sparse matrices are downsampled so that their structure is visible in the plot generated by MatrixPlot." What this means in practice is some averaging will happen for sizes past some threshold. You can avert this by specifying MaxPlotPoints->Max[Dimensions[mR197C11].

POSTED BY: Daniel Lichtblau

MatrixPlot works for any dimensions of square matricies but it has problems with non square matrices .In the case of the{ 157,11} matrix the problem starts at { 121,11).

Comparison between {120 , 11} and {121,11}

enter image description here

POSTED BY: Doug Beveridge
Reply to this discussion
Community posts can be styled and formatted using the Markdown syntax.
Reply Preview
Attachments
Remove
or Discard

Group Abstract Group Abstract