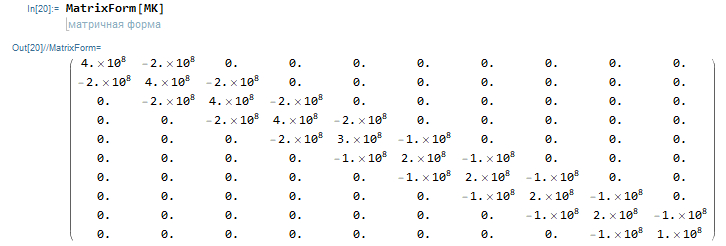
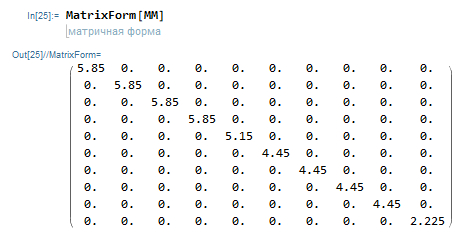
Solved the problem of one-dimensional oscillations by the finite element method and wrote the following code for the numerical solution of differential equations.
s = NDSolve[{MM . y''[x] + MK . y[x] == pnull, y[0] == ynol,y'[0] == yshtrihnol}, y[x], {x, 0, 50}]
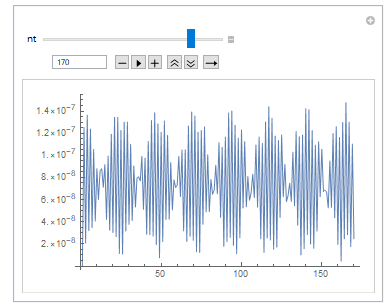
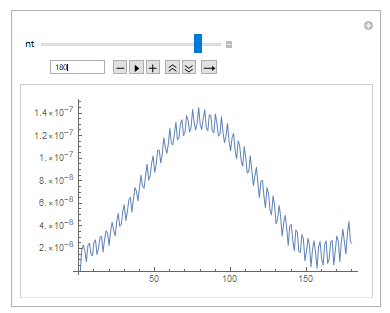
Manipulate[ ListPlot[Table[y[x] /. First[s], {x, 0, 50, 50/(nt - 1)}][[All, 10]],Joined -> True], {nt, 10, 200}]
pnull = {0., 0., 0., 0., 0., 0., 0., 0., 0., 1.};
ynol = {0., 0., 0., 0., 0., 0., 0., 0., 0., 0.};
yshtrihnol = {0., 0., 0., 0., 0., 0., 0., 0., 0., 0.};
The problem is that increasing nt should just increase the number of partitions to plot and make the sine wave more accurate, but in reality, the plot changes unpredictably with an increase in the number of points to plot. What did I misunderstand or do? 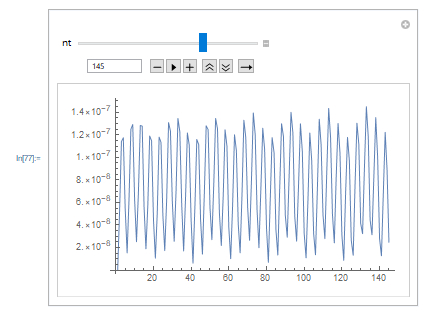
 Attachments:


