I would like to create interactive Plots with Wolfram Cloud, to use in company. It would be a nice way to show Mathematica power to analyze and display information.
The problem is that when I publish some toy code like:
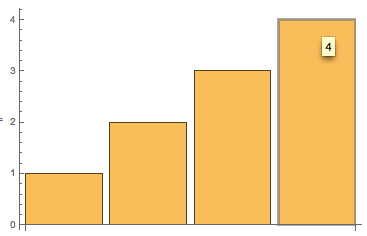
plot = BarChart[Tooltip /@ {1, 2, 3, 4}]

CloudDeploy[plot, "kpiAcuracidade", Permissions -> "Public"]
I get a flat image with no interactivity (no tooltip for example).
There is some another way to publish that can show Tooltips and Hyperlinks? Or that I can use more advanced Dynamics where I can click in a bar chart, an drill down over information?
UPDATE
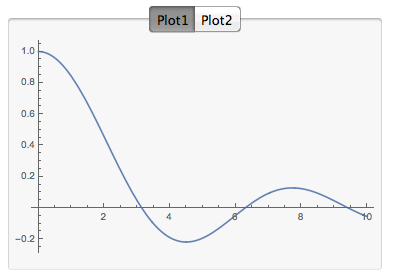
Here is another example of dynamic interface the do not work yet.
CloudDeploy@TabView[{"Plot1"->Plot[Sinc@x,{x,0,10}] ,"Plot2"->Plot[Sinh@x,{x,0,10}] }]
