Below is my code, you need to use the DensityPlot function or similar to it to build the diagrams shown in the image. What code do I need to add to my program to make this happen? Please help, I need it for my Bachelor's degree!
This code solves a differential equation, the solution of which is a phase velocity graph consisting of maxima, i.e. peaks. Each time jdc and jac are changed from 0 to 3, different dependencies are built, where 1, 2 or more peaks are visible on the graph in one period. And after that, you need to build a chart like this. jth - a threshold equal to 2.08.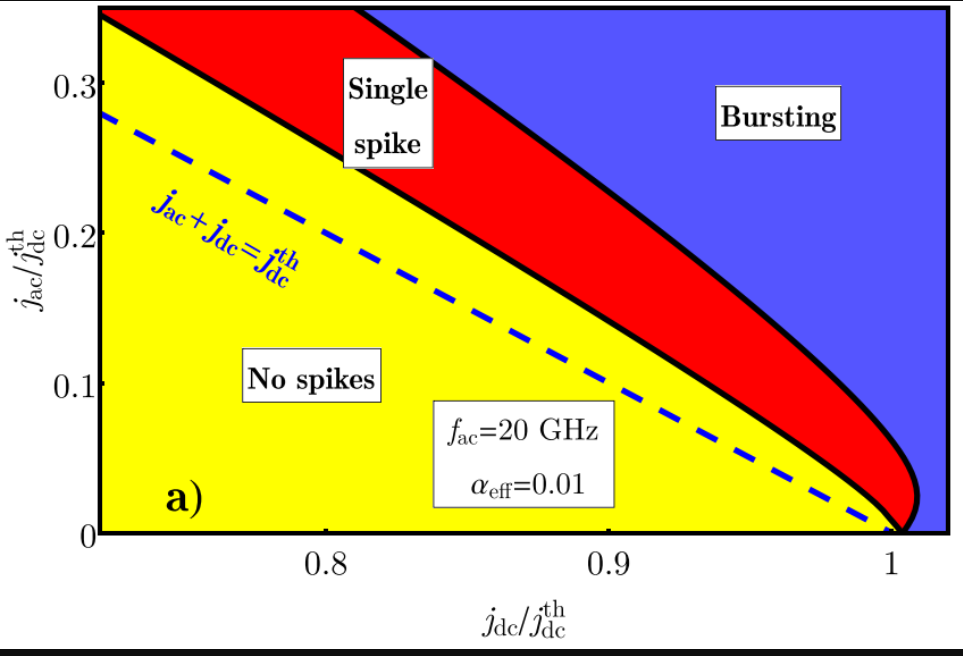
 Attachments:


