This can be done more directly, and perhaps more accurately, if one creates interpolations of both x and y values and then checks where x'[t] vanishes. This last can be done using for example NDSolve and event location. I'll show solving for both coordinates (so we can see that plots match) but really only the x'[t] equation and solution is required.
len = Length[data];
xParametrized =
  Interpolation[Log[data[[All, 1]] - Min[data[[All, 1]]] + 1], t,
   InterpolationOrder -> 5, Method -> "Spline"];
yParametrized =
  Interpolation[Log[data[[All, 2]] - Min[data[[All, 2]]] + 1], t,
   InterpolationOrder -> 5, Method -> "Spline"];

inits = Thread[{x[1], y[1]} ==
    Log[data[[1]] - Map[Min, Transpose[data]] + 1]];
odes = Thread[{x'[t], y'[t]} == D[{xParametrized, yParametrized}, t]];

tvals =
 Reap[(ndsoln =
     NDSolveValue[
      Join[odes, inits, {WhenEvent[x'[t] == 0, Sow[t]]}], {x[t],
       y[t]}, {t, 1, len}])][[2, 1]]

(* Out[168]= {12.4753, 54.8482, 97.8302, 141.446}*)
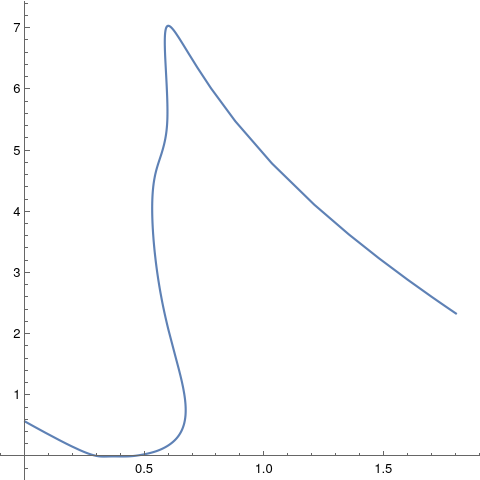
First note that the solution matches the interpolation.
ParametricPlot[{xParametrized, yParametrized}, {t, 1, len},
 AspectRatio -> 1, PlotRange -> All]
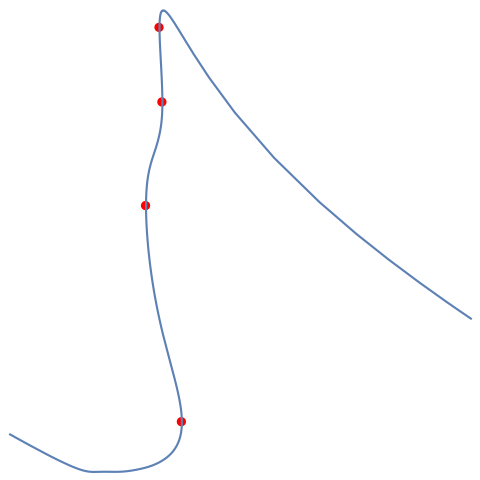
Compare to the solution, now with the turning points added:
gt = Graphics[
   turningpoints =
    Map[{Red, PointSize[Large], Point[#]} &,
     Transpose[{xParametrized, yParametrized} /. t -> tvals]]];
Show[{gt,
  ParametricPlot[ndsoln, {t, 1, len}, AspectRatio -> 1,
   PlotRange -> All]}, AspectRatio -> 1, PlotRange -> All]