Message Boards Message Boards

0
|
1241 Views
|
2 Replies
|
1 Total Likes
View groups...
Share
Share this post:

Multivariable function using two list

Posted 1 year ago

I have a function it uses two list of values. the shape of x and y list gives a triangle.

enter image description here

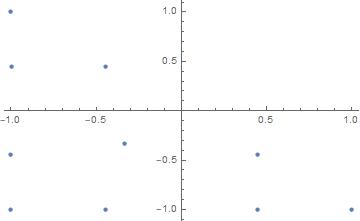
xlist={-1., -0.447214, 0.447214, 1., -1., -0.333333, 0.447214, -1.,-0.447214, -1.}

ylist={-1., -1., -1., -1., -0.447214, -0.333333, -0.447214, 0.447214,0.447214, 1.}

function f=(1 + 2x +5) (3 + 5 y)

I want to plot function in 3d with xlist on x axis ylist in y axis and see the funtion using this values in plot

I usually plot with x and y "min max range" with function, it gives a rectangle domain style shape as expected.

In this plot it will seem like a triangle bended carpet shape enter image description here

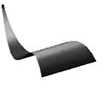
Thanks a lot regards

Attachments:
POSTED BY: joseph Jo
2 Replies
Posted 1 year ago

Thanks so much Eric

Best regards,

POSTED BY: joseph Jo
Posted 1 year ago

Define your function:

f[x_, y_] := (1 + 2 x + 5) (3 + 5 y)

You might want to use ListPlot3D and so we want to get our data in the proper form. We can do that with MapThread:

MapThread[{##, f[##]} &, {ksilist, etalist}]

So, putting it all together:

ListPlot3D[MapThread[{##, f[##]} &, {ksilist, etalist}]]

enter image description here

POSTED BY: Eric Rimbey
Reply to this discussion
Community posts can be styled and formatted using the Markdown syntax.
Reply Preview
Attachments
Remove
or Discard

Group Abstract Group Abstract