Thank you for valuable help
How to change the origin of these plots?
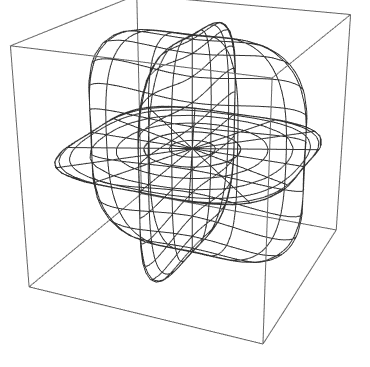
\[Alpha] = Sin[\[Theta]] Cos[\[Phi]]; \[Beta] =
 Sin[\[Theta]] Sin[\[Phi]]; \[Gamma] = Cos[\[Theta]];
t[\[Theta]_, \[Phi]_] :=
  1/(0.0041542 - (2 (0.0041542 + 0.0011726) -
        0.0079190) (\[Alpha]^2 \[Beta]^2 + \[Alpha]^2 \[Gamma]^2 + \
\[Beta]^2 \[Gamma]^2));
wireframe =
 SphericalPlot3D[
  t[\[Theta], \[Phi]], {\[Theta], 0, Pi}, {\[Phi], 0, 2 Pi},
  Axes -> True,
  Ticks -> {{-200, -100, 0, 100, 200}, {-200, -100, 0, 100,
     200}, {-200, -100, 0, 100, 200}},
  LabelStyle -> {FontSize -> 12, FontFamily -> "Times", Black},
  ImageSize -> {350, 350}, FaceGridsStyle -> Directive[Black, Dashed],
   ImagePadding -> 50, LabelStyle -> Directive[Bold, Black],
  ColorFunction -> (ColorData["DarkRainbow"][#6] &), PlotStyle -> None]


p1 = Graphics3D[
  Normal[wireframe[[1]]] /.
   Line[lst_] :>
    Line[Map[Function[xyz, {xyz[[1]], xyz[[2]], 0}], lst]]]
p2 = Graphics3D[
  Normal[wireframe[[1]]] /.
   Line[lst_] :>
    Line[Map[Function[xyz, {xyz[[1]], 0, xyz[[3]]}], lst]]]
p3 = Graphics3D[
  Normal[wireframe[[1]]] /.
   Line[lst_] :>
    Line[Map[Function[xyz, {0, xyz[[2]], xyz[[3]]}], lst]]]


Show[p1, p2, p3, PlotRange -> All, BoxRatios -> {1, 1, 1}]