Message Boards Message Boards

0
|
1478 Views
|
3 Replies
|
2 Total Likes
View groups...
Share
Share this post:

GrayLevel plots of complex functions?

Posted 1 year ago

Because of restrictions in a print journal I am unable to render complex functions in the plane using a color wheel for the phase of the complex numbers. The best I have been able to come up with is to add contours, in black, of a small set of phase angles, say -3Pi/4, -Pi/4, Pi/4, 3Pi/4.

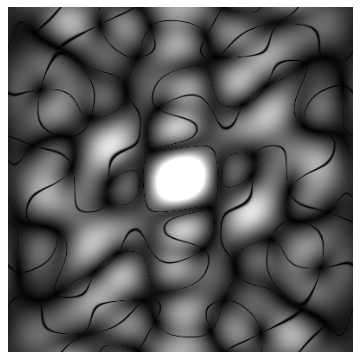
Here is a typical case of the kind of complex function I am trying to render. First, a plot where I apply Abs[#] to the complex numbers:

enter image description here

This is what I get when I multiply by the function

width = .001;

contours = Table[(a/4.) Pi, {a, -3, 3, 2}];

zeroArgs[a_] := (1 - Exp[-#^2/width]) &[Nearest[contours, a][[1]] - a]

enter image description here

Is there a better option I should know about?

POSTED BY: Veit Elser
3 Replies
Posted 1 year ago

Inspired by Henrik's idea, I came up with the following scheme (magnitude on the left, magnitude + phase ramps on the right):

enter image description here

I take the phase mod Pi/2 to get four sets of phase ramps and after mapping into the range [0,1] I also raise to the 10th power so the ramps, when added to the magnitudes, don't distract from the magnitudes.

POSTED BY: Veit Elser

Would something like this work for you?

func[x_, y_] := (-3 + (x + I y)^5)/(x + I y)^3

DensityPlot[Arg[func[x, y]], {x, -2, 2}, {y, -2, 2}, 
 MeshFunctions -> {(#3 &), Log[Abs[func[#1, #2]]] &}, 
 Mesh -> {30, 250}, ColorFunction -> GrayLevel, ImageSize -> Large, 
 PlotPoints -> 50]

enter image description here

POSTED BY: Henrik Schachner
Posted 1 year ago

Thanks! I should have emphasized that the plot also shows the magnitude (which diverges in your example). Here's how my method renders your function:

enter image description here

My functions don't diverge as they are defined by the Fourier transform. Here's how I've been generating them:

supp = 10; size = 400; prob = .2;

image = RotateLeft[ PadRight[ RandomInteger[BernoulliDistribution[prob], {supp, supp}], {size, size}], Floor[{supp, supp}/2]];

fourier = RotateRight[Fourier[image], Floor[{size, size}/2]];

POSTED BY: Veit Elser
Reply to this discussion
Community posts can be styled and formatted using the Markdown syntax.
Reply Preview
Attachments
Remove
or Discard

Group Abstract Group Abstract