Message Boards Message Boards

0
|
2263 Views
|
3 Replies
|
0 Total Likes
View groups...
Share
Share this post:

Plot specific named columns of a dataset

Posted 10 months ago

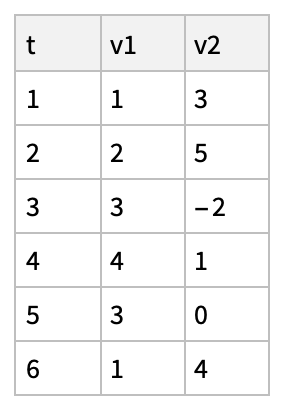
Suppose I have the following dataset:

dataset = Dataset[{
   <|"t" -> 1, "v1" -> 1, "v2" -> 3|>,
   <|"t" -> 2, "v1" -> 2, "v2" -> 5|>,
   <|"t" -> 3, "v1" -> 3, "v2" -> -2|>,
   <|"t" -> 4, "v1" -> 4, "v2" -> 1|>,
   <|"t" -> 5, "v1" -> 3, "v2" -> 0|>,
   <|"t" -> 6, "v1" -> 1, "v2" -> 4|>}]

enter image description here

I now want to create a ListPlot of t vs v1.

What I do now is

ListPlot[
 Thread[{
   dataset[All, "t"] // Normal
   ,
   dataset[All, "v2"] // Normal
   }]
 ]

but I I don't find it very efficient.

Is there another way to get this plot that makes use of the dataset headers?

POSTED BY: Ehud Behar
3 Replies

It can be this simple:

dataset[ListPlot, {"t", "v1"}]
POSTED BY: Carl Verdon

You can reverse the order:

dataset[All, {"t", "v1"}][ListPlot]
POSTED BY: Gianluca Gorni
Posted 10 months ago

I think ListPlot is designed to work with regularized datasets. So, just do this:

ListPlot[dataset[All, {"t", "v1"}]]
POSTED BY: Eric Rimbey
Reply to this discussion
Community posts can be styled and formatted using the Markdown syntax.
Reply Preview
Attachments
Remove
or Discard

Group Abstract Group Abstract