Hi everyone! I have the following dataset,
{{2.55013575963127409*10^-9,
  1.19645076463458920*10^-9}, {2.55013575963127409*10^-9,
  4.7424792036488750*10^-9}, {2.55013575963127409*10^-9,
  6.3245254240115577*10^-9}, {2.55013575963127409*10^-9,
  5.5802525593114994*10^-8}, {2.55013575963127409*10^-9,
  4.06370257734930112*10^-10}, {2.55013575963127409*10^-9,
  1.64896569576873640*10^-8}, {2.55013575963127409*10^-9,
  1.39340153097326414*10^-8}, {2.55013575963127409*10^-9,
  2.41797604421833683*10^-10}, {2.55013575963127409*10^-9,
  1.99051774147692447*10^-7}, {2.55013575963127409*10^-9,
  1.35179704266471813*10^-9}, {2.55013575963127409*10^-9,
  1.01798818440611066*10^-8}, {2.55013575963127409*10^-9,
  6.2249223322278943*10^-10}, {2.55013575963127409*10^-9,
  1.55986113967169152*10^-9}, {2.55013575963127409*10^-9,
  8.2859429548833167*10^-8}, {2.55013575963127409*10^-9,
  4.9286219130690405*10^-8}, {2.55013575963127409*10^-9,
  1.13071080469827454*10^-9}, {2.55013575963127409*10^-9,
  4.4885508068659125*10^-8}, {2.55013575963127409*10^-9,
  1.02943785774500959*10^-9}, {2.55013575963127409*10^-9,
  1.75516157507556027*10^-10}, {2.55013575963127409*10^-9,
  2.88165919706538189*10^-10}, {2.55013575963127409*10^-9,
  6.3788472362952668*10^-10}, {2.55013575963127409*10^-9,
  1.46843459162346721*10^-10}, {2.55013575963127409*10^-9,
  2.23358682055777471*10^-9}, {2.55013575963127409*10^-9,
  8.6574454462290365*10^-8}, {2.55013575963127409*10^-9,
  2.52716401075923159*10^-8}, {2.55013575963127409*10^-9,
  1.06401163631527839*10^-10}, {2.55013575963127409*10^-9,
  4.22182284947669552*10^-7}, {2.55013575963127409*10^-9,
  1.02775004504317092*10^-7}, {2.55013575963127409*10^-9,
  5.6340277185040513*10^-10}, {2.55013575963127409*10^-9,
  1.23822565711089037*10^-7}}
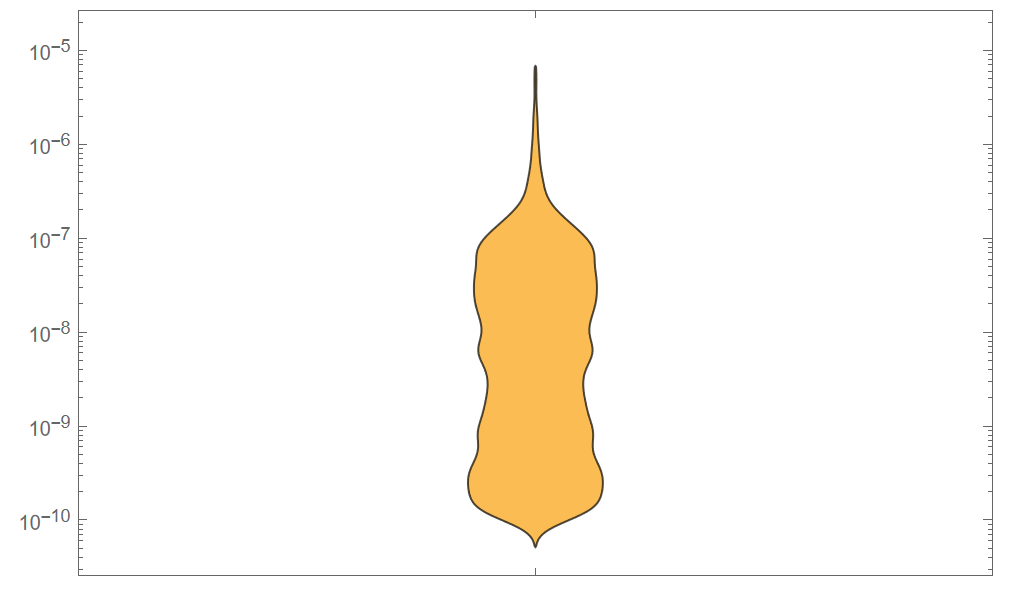
I want to make a violin plot of it, which I know can make using DistributionChart,
f0 = 10^Freq0[[All, 2]];
DistributionChart[{f0}, ImageSize -> 490,
 ScalingFunctions -> {"Log", "Log"}]
I plotted and got the following image,
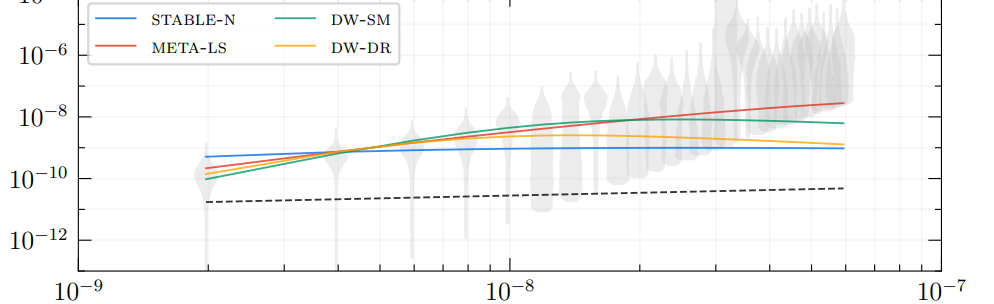
I now want to show the x-axis which is just a fix number as can be seen from data. And then I want to show this Violin plot along with some other plo such that it appears exactly at 2.55013575963127409*10^-9 like,
Can anyone please guide me how I can do it in mathematica?


