Július, here is an empirical approach:
The idea is to consider the first derivative of the interpolation, because this way the composition of the whole curve seems to become more obvious:
(* some test data: *)
data = Table[N@Sin[x], {x, 0, 30}];
(* interpolated function - order '3' is default anyway: *)
func = Interpolation[data, InterpolationOrder -> 3];
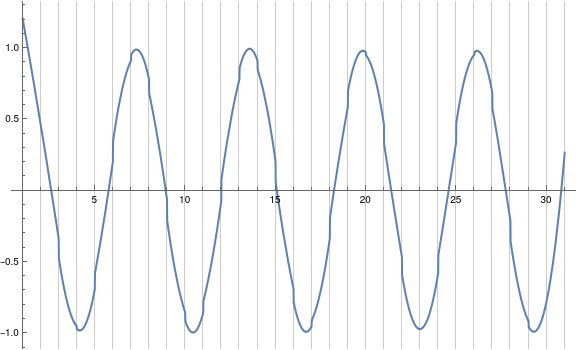
(* plotting its derivative: *)
xrange = func[[1, 1]]; Plot @@ {func'[x], Flatten@{x, xrange}, GridLines -> {Range @@ xrange, None}, ImageSize -> Large}
You can mimic the very same (apart from some shift in x) using interpolating polynomials in a piecewise manner:
(* preparation for polynomial interpolation of order '3': *)
ddata = Partition[MapIndexed[{First[#2 - 1], #1} &, data], 4, 1];
(* calculation of the polynomials: *)
iPolygs = Expand@InterpolatingPolynomial[#, x] & /@ ddata;
(* first derivative: *)
diPolygs = D[#, x] & /@ iPolygs;
xrange = Length[diPolygs];
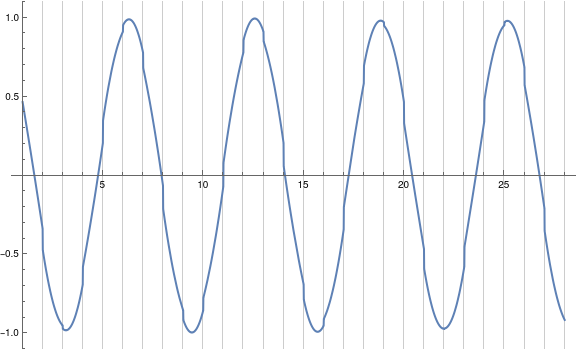
(* piecewise plotting: *)
Plot[diPolygs[[Round[x - .5]]], {x, 1, xrange}, GridLines -> {Range[xrange], None}, ImageSize -> Large]
So - in a way that might be an answer to your question. (?)
Regards -- Henrik


