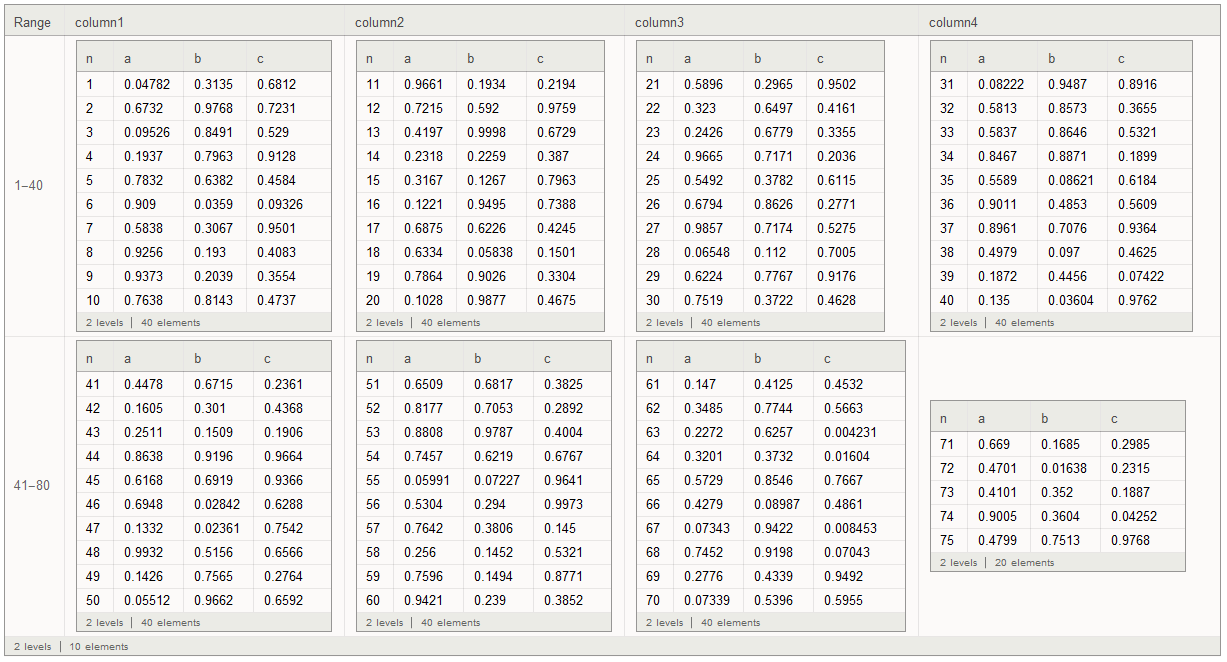
In my use of Datasets I've noticed Mathematica does a decent job of displaying nested data, though individual arrays are still limited to 16 values. To show more data let's build a dataset of nested data..
The inputs are the dataset to display and the number of columns to display. Multiple columns make better use of screen real estate.
showds[ds_, cols_] :=
 Module[{top = Length[ds], rowasc, range, dslist = {}},
  Do[rowasc = <|"Range" -> ToString[range] <> "-" <> ToString[range + 10*cols - 1]|>;
   Do[AppendTo[rowasc, "column" <> ToString[col] -> ds[range + 10*(col - 1) ;; range + 10*(col - 1) + 9]], {col, 1, cols}];
   range = range + 10*cols;
   dslist = Append[dslist, rowasc];
   , {range, 1, top, 10*cols}];
  Dataset[dslist]
  ]
Test data. The "n" is to help track the results and avoid confirmation bias. Too bad the forum downsizes the image, attached for the curious.
dataset =  Dataset[Table[<|"n" -> i, "a" -> RandomReal[], "b" -> RandomReal[],  "c" -> RandomReal[]|>, {i, 1, 75}]];
showds[dataset,4]
