I found a much better and simpler solution on stackexchange that works with diffrent plots including "ParametricPlot". thanks to the user kglr
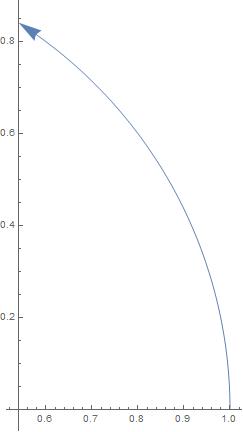
p0 = ParametricPlot[{Cos[t], Sin[t]}, {t, 0, 1}]
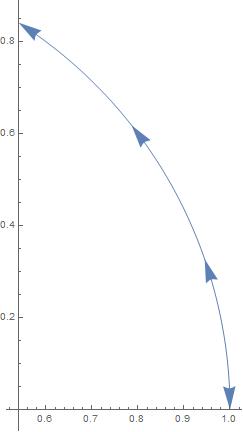
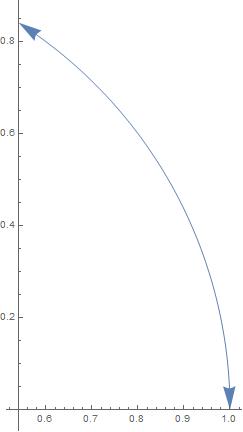
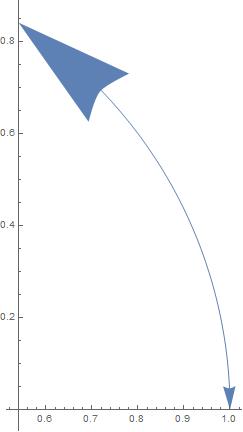
(*numbers used Arrowheads argument define the size of arrow heads and plot will be divided bt the length of arguments in list to place arrow*)
(*negative numbers means reverse arrow*)
p0 /. Line[x_] :> {Arrowheads[{.1}], Arrow[x]}
p0 /. Line[x_] :> {Arrowheads[{-.1, .1}], Arrow[x]}
p0 /. Line[x_] :> {Arrowheads[{-.1, .5}], Arrow[x]}
p0 /. Line[x_] :> {Arrowheads[{-.1, .1, .1, .1}], Arrow[x]}