Here is a quiz Mandelbrot gives. Of the difference graphs below, one is Brownian motion, one fractional Brownian motion, one a Levy process, two are real financial data, and three are multifractal forgeries. Can you tell which is which? 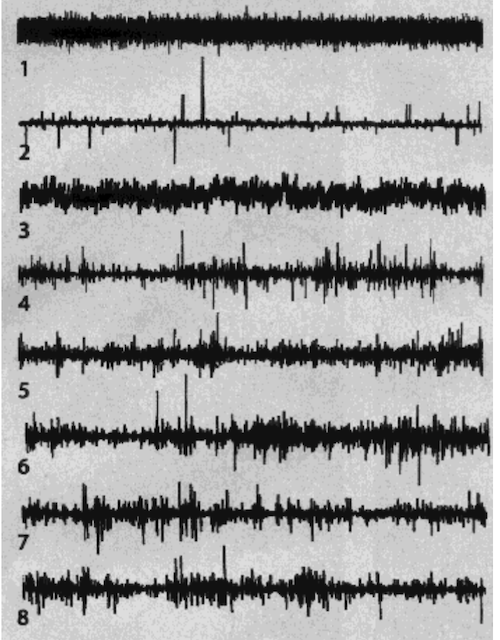
Answers here
I am fascinated by Mandelbrot's visual approach to science. In his book Misbehavior of Markets he comments,
Pictures are undervalued in science. A modern diagram or chart can be as precise as desired, and is no more costly than the computer that draws it. The picture can now aid, not mislead the scientist. It permits instant comparison, instant comprehension.
There was a famous scientific debate including the now late Daniel Kahneman over whether the "Hot Hand" effect was real or not. Current consensus is that it is real. I was curious if there was a "Hot Team" effect where teams were more likely to score after scoring. In my experience as a college basketball player and coach, it certainly feels like this exists. And basketball practitioners swear by it:
"Basketball is a game of runs!", they say.
I tried to tackle this problem using Mandelbrot's method, but found (at least on initial testing) that his eye test is not sensitive enough to pick up small changes of 2.5% dependence, which if the hot team effect exists it will be small. Here's what the Mandelbrot test looks like for 10,000 steps in a random walk with .525 probability dependence, meaning if you get a 1 you have a .525 chance of getting another 1 and same for -1.
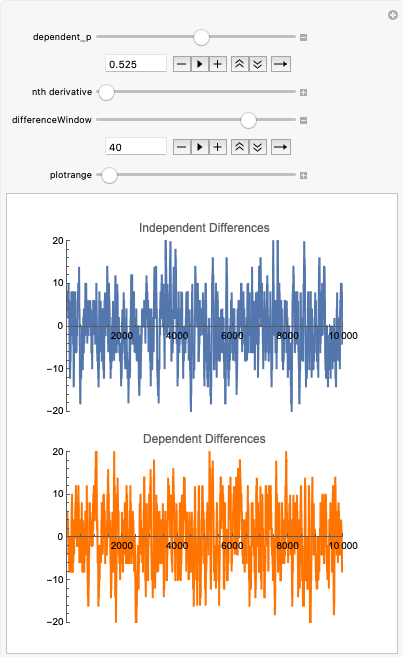
I have to generate more samples to really double-check if it can pick up the difference but just from that image I can't really tell.
So I devised a test that counts up the number of streaks of length 2 and plots their frequency. You can divide it up into chunks, to make it easier to see the difference between values. It looks like this:
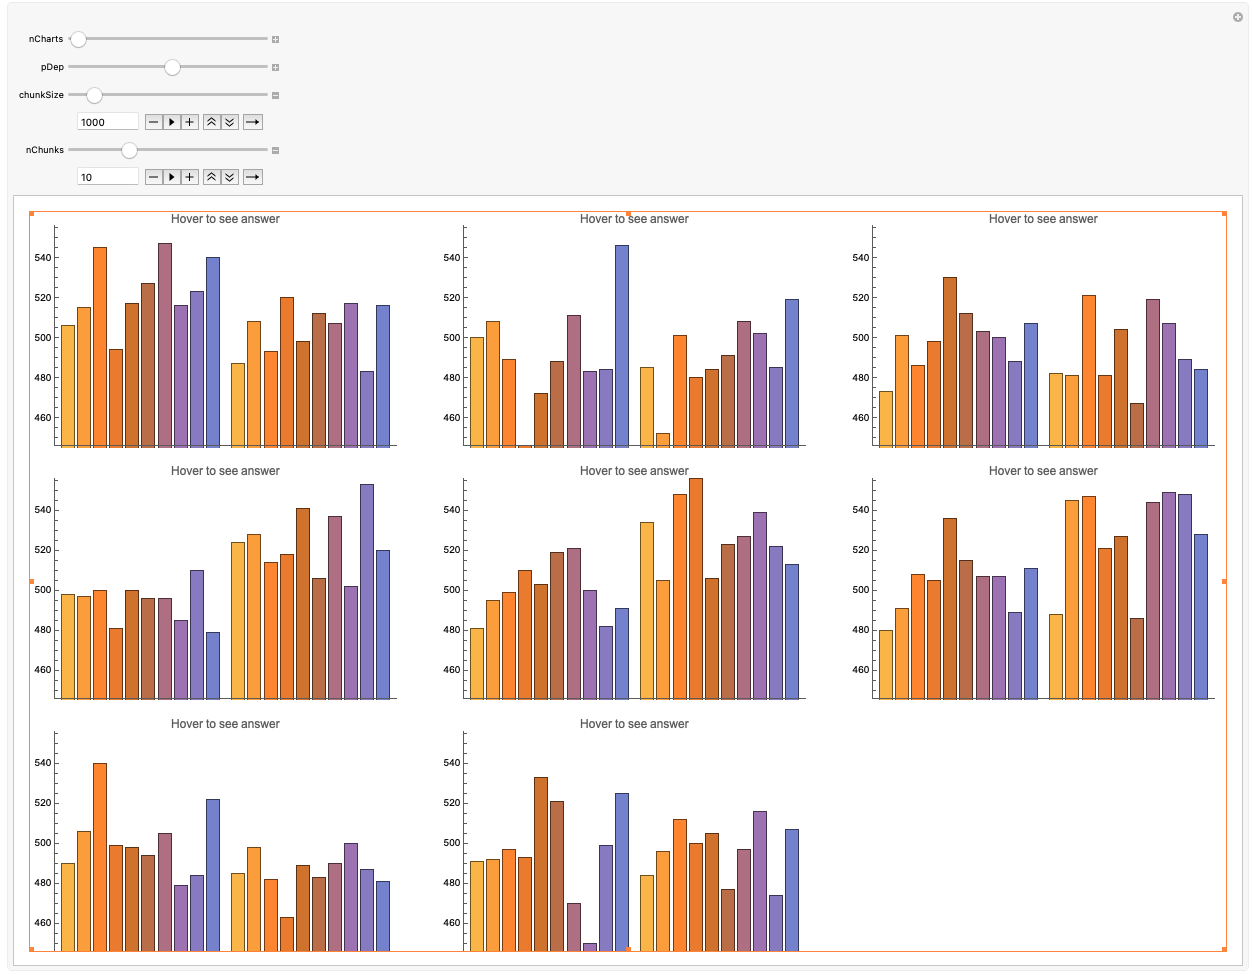
So here you can actually test yourself using the manipulate to see if you can tell which one is dependent and which one is independent. With 10 chunks of 1000 and a dependence of 0.525, I am about 95% accurate at telling the difference, which is an improvement on the initial Mandelbrot method which I couldn't really tell at all. With 10 chunks of 500 I performed at about 80%. Once you go lower than that it starts to become impossible because I think the information is not actually there.
I encourage you to give it a try.
I applied this method to the Portland Trail Blazers NBA Team data and found that it didn't look dependent, which is evidence for this paper here. Here's what it looked like:
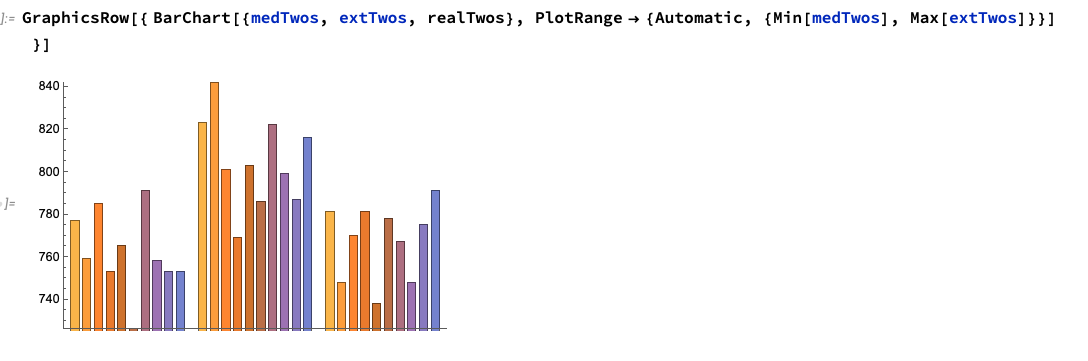
On the left is fake independent data, in the middle is fake dependent data (p = 0.525) and on the right is the real data.
I'm working on trying out my eye test on college basketball and tennis data. Overall I think it's a powerful tool for detecting dependence without knowing the mathematics behind it. It's science for dummies, like me, who can't get their head around probability formulas. On a bigger picture it's a method for finding effective visual models for random events. My plan is to build up a set of tests so that I can quickly understand data with minimal effort.
Here's the notebook to use the manipulates for yourself:


