Hello,
I am looking for an option that specifies the edges of the bounding box and axes to be drawn similar to the following graph.
I tried:
Plot3D[x^2+y^2, {x, -2, 2}, {y, -2,2}, AxesEdge -> Automatic, Boxed->False]
but it does not work.
Any help would be greatly appreciated. Thank you!
There is a built-in plot theme:
(*First@*)Plot3D[x^2 + y^2, {x, -2, 2}, {y, -2, 2}, PlotTheme -> "Detailed"]
Uncomment the First@ if you want to remove the plot legend.
First@
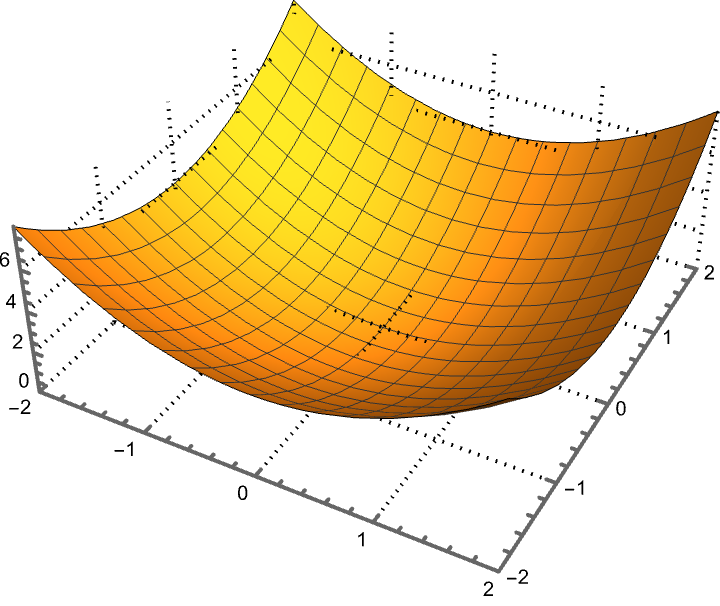
Here is a start
Plot3D[
 x^2 + y^2, {x, -2, 2}, {y, -2, 2},
 Boxed -> False,
 FaceGrids -> {{0, 0, -1}, {-1, 0, 0}, {0, 1, 0}},
 FaceGridsStyle -> Directive[Thick, Black, Dotted],
 PlotRangePadding -> None,
 AxesStyle -> Thick]