The evolution of notebook environments, led by Wolfram Mathematica and later by Jupyter Notebook in the open-source segment, has established a standard for working with code, data, and visualizations. While tools like VS Code and NTeract have adopted the Jupyter Notebook interface, they often provide only static results without the interactive capabilities. Frankly speaking, Wolfram Mathematica offers the most powerful dynamic capabilities. However, being proprietary software leaves the open-source market without strong alternatives. Projects like Julia’s Pluto combine features of Jupyter and Observable, enabling dynamic evaluation, which sounds like the next step for the open-source community resembling closer what Mathematica can offer.
We introduce another branch of development in the section of open-source dynamic notebook environments for Wolfram Language distributions — the WLJS Notebook project, which is strongly focused on the following features:
- Multimodal Cells Treat images, equations, files, and other elements as normal language expressions, akin to Mathematica but open-source and Javascript based. Make presentations, read and write files from the notebook cells.
- Smooth and Predictable Dynamics Bind buttons, sliders to graphics primitives (lines, dots, polygons and etc) or to a custom Javascript code using event-based approach.
- Portable notebooks Export and pack all data to a standalone
.htmlfile keeping all plots and 3D graphics interactive and working offline.
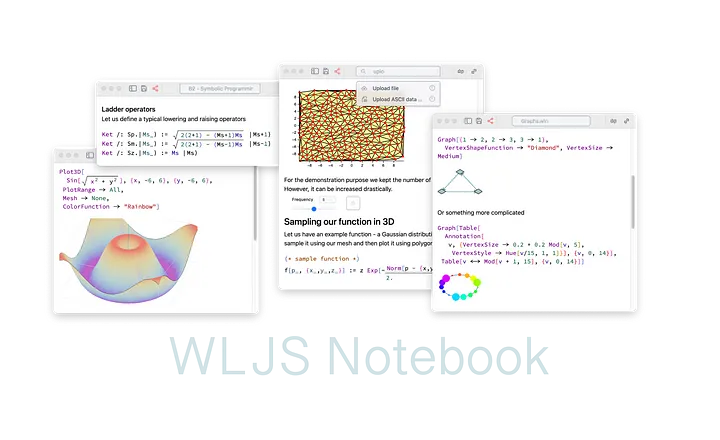
We aim to help the open-source community explore the Wolfram Language by providing an alternative to Jupyter Notebook, featuring 2D math input, beautiful syntax sugar, and everything else that people find fascinating in Mathematica.
In this story, we will explore how to create simple notebooks, data-driven presentations, and interactive widgets using WLJS Notebook.
About the author
I am PhD student working in quantum physics @ Augsburg University and one of developers — Kirill Vasin. WLJS Notebook was originally developed to help in teaching students, processing data, making interactive reports and help open-source community to explore Wolfram Language (distributed as freeware Wolfram Engine). However, our project does not belong to any company and is not sponsored by any organization.
Installation
Please see WLJS Docs page for binaries
WLJS Notebook is an open-source notebook interface, set of libraries for 2D/3D graphics, GUI building blocks, code editor made for a freeware distribution of Wolfram Language (Wolfram Engine)
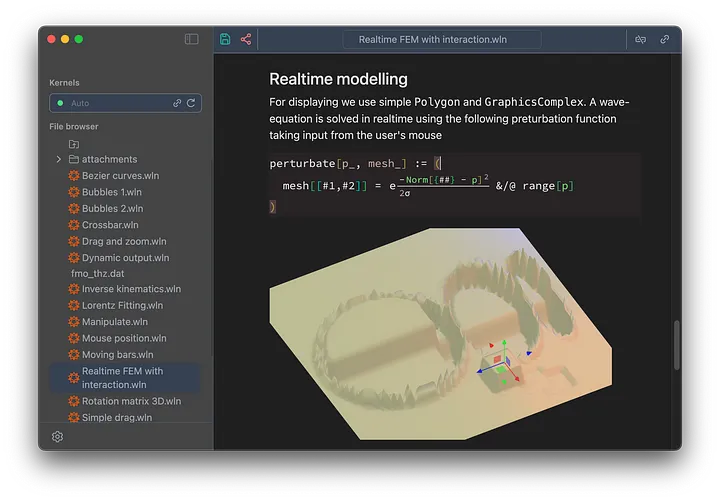
Dark mode of WLJS Notebook on MacOS with a hidden Medium logo
It is distributed as Electron desktop application for all platforms and as standalone server similar to JupiterLab/Jupiter and works fully offline
- Download and install Wolfram Engine — a command line interface and REPL (Read–eval–print loop system) for Wolfram Language.
- Get a free developer license (usually on the same page as p. 1).
- Install WLJS Notebook from releases page and run
- Type your account data to the installation window to activate Wolfram Engine (if needed)
Basic examples
WLJS Notebook uses Wolfram Language (WL), which is distributed as a freeware console application - Wolfram Engine. Like Python, it comes with a vast standard library that can fulfill many needs from quite narrow fields
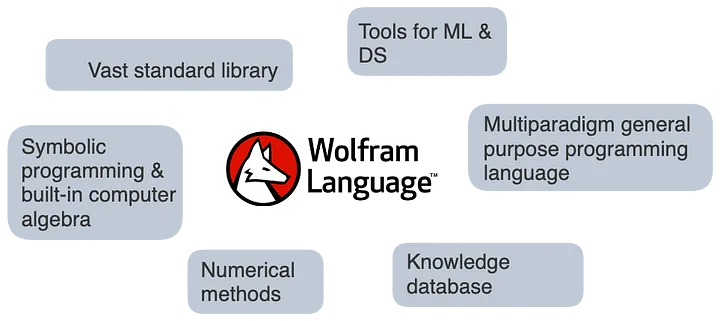
A sketch of some application areas and features of WL
Short introduction to symbolic programming
There is common misinterpretation, that WL is designed for taking integrals and calculations in math and physics. However, this is not true since there are projects implementing the whole TCP, HTTP, WebSockets stack and even fullstack frontend framework
There is no such thing as a derivative or an integral in the core of the language, but some general transformation rules, which tuned out to fit nicely the concepts of linear algebra, differential calculus. From here we can get familiar with first core concept of symbolic programming
- all calculations are done by applying set of transformation rules
- functions and procedures are subsets of rules
Let’s create our first notebook and play with it

An input cell in the notebook
For example this is how the simplest transformation rule apples to a list of integers
{1,1,2,2,2,2} /. {2 -> 1, 1 -> 0}

Expected output
It is important to note, than an output is still a normal Wolfram Language expression and can be directly used in this form for a new evaluation, i.e.
{0,0,1,1,1,1} /. {i_Integer :> i / 2}

Output decorated with syntax sugar
Here what you see

is actually written in the code editor as
(*FB[*)((1)(*,*)/(*,*)(2))(*]FB*)
Looking closely at it, we can see that it is still a normal (1/2) expression like in any other programming language. However, it is wrapped with some special comment blocks, that tells an editor how to render it.
In the example above we used a specific pattern to match and then replace it with a new expression. We could use kinda a wildcard pattern (Blank) as well, that will not change the final result, but acts on the expression in a completely different way
{0,0,1,1,1,1} /. {i_ :> i / 2}

An output expression decorated with syntax sugar
Those curly brackets are actually a shorthand notation of List expression (aka array). Then our rule can already be applied to an entire array, unlike the earlier example, where it was applied to individual elements
{0,0,1,1,1,1} -> {0,0,1,1,1,1} /2 -> {0,0,1/2,1/2,1/2,1/2}
We can prove that in the case above the rule was applied to an entire array unlike in the previous example with individual elements
{0,0,1,1,1,1} /. {i_Integer :> d[i]}
{0,0,1,1,1,1} /. {i_ :> d[i]}
and as the result we will get
{d[0],d[0],d[1],d[1],d[1],d[1]}
d[{0,0,1,1,1,1}]
Here we used an undefined symbol d to demonstrate explicitly how the rule is applied. This did not lead to an error, since it was again just a Wolfram Expression.
One can go even further in exploring the idea of symbolics and syntax sugar of WL and our editor by applying more complicated rule
{0,0,1/2,1/2,1/2,1/2} /. {any_?NumericQ :> {RGBColor[any, 1-any, 1], any} }
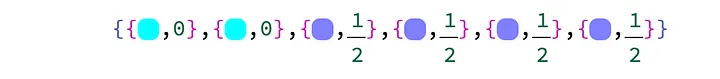
An output expression
As one can see, Wolfram Language does not differentiate what you are typing: a color, a function, a number. All of them are normal Wolfram Language expressions.
There are also built-in expression used for styling the output
% // Transpose // TableForm
here % means to use the previous output and // is a shorthand notation for applying expressions from the right

An output expression
Or something even more complicated
Table[If[PrimeQ[i], Framed[i, Background->Yellow], i], {i, 1, 20}]
this expression will make an array of numbers and highlight primes
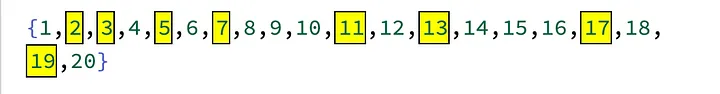
An output expression
And remember, this is still a valid and fully editable Wolfram Expression. One can reevaluate it and all temporal decorations will be gone.
How to plot something
Do you remember that plotting data must be as easy as to use MS Excel? To make importing some typical ASCII data (.dat files) faster, one can use a built-in snippet from the command palette
A helper snippet for importing data
Here you notice a shorthand syntax // , which simply applies function from the right to the expression on the left (in our case this is a file).
One can also do it manually using Import expression
ListLinePlot[ Import["path_to_you_data.dat", "TSV"] ]
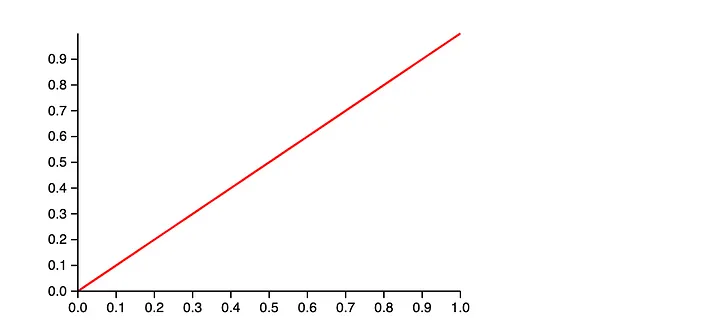
If you do modeling, analytical functions are even easier to plot
Plot[x, {x,0,1}, PlotStyle -> RGBColor[1/2, 1/2, 1]]
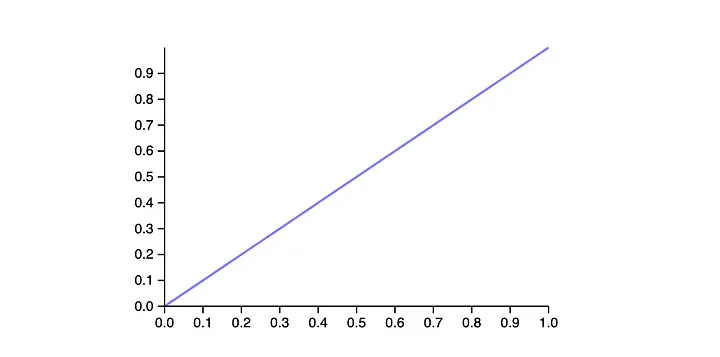
An output expression
This is again a Wolfram Language expression. We can prove this, by applying a transformation rule on it
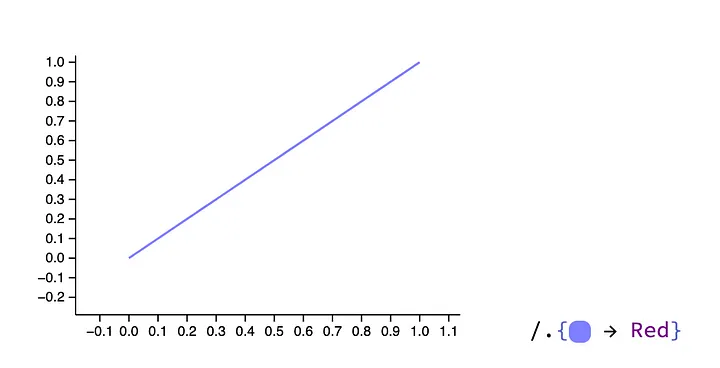 An input cell
 An output cell
Here we can learn another aspect of symbolic programming
- code and data are language expressions
- everything is computable expression It perfectly decouples a language expression from its interpretation like separating data from its presentation.
Another example is interpretation of symbols representing abstract objects. For example take a look at Cuboid , which is a generalized 3D cube, which can be used in multiple ways
1 as a graphics primitive
Graphics3D[ Cuboid[{-1,-1,-1}, {1,1,1}] ]

An output expression
2 as a symbolic representation of a geometric object
    Volume[ Cuboid[{a1,a2,a3}, {b1,b2,b3}] ]

    Abs[(-a1+b1) (-a2+b2) (-a3+b3)]
output expression
The great thing is, that you can define your own rules for your symbols as well. As a user you are as powerful as a magic behind 1+1 == 2
Working with a multimodal input
A one of the common reason why physicist, chemists and other non-programmer do not like classical programming is
(a b) / Sqrt[2]
which could look and feel like this instead
An example of right-looking math
Since WL allows us to apply transformation rules on output result, it must be possible to define a form for a good-looking expression, which can still be valid as an input code. A good compromise is to do in invisible way for a computational kernel, but visible for our code editor
(*FB[*)((a b)(*,*)/(*,*)((*SqB[*)Sqrt[2](*]SqB*)))(*]FB*)
Here (**) are comment blocks, they give some hints to an editor on how to render an expression. It solves a couple of issues
- an expression is still compatible with
InputForm (normal expressions)
- it does not alter the code structure
- it contains all markers for an editor, there is no need in tokenizing and parsing actual language expressions The rest is a question of many carefully crafted regular expressions of Code Mirror 6 extension
Our implementation of editable math syntax sugar
Try this in the notebook by yourself!
There are following shortcuts available for math-typing
Ctrl+/ makes fraction on the selectionCtrl+2 makes square rootCtrl+6 make power superscript In principle such decorations are generalized in a way, that frontend can decorate any Wolfram Expression using the following approach
evaluate the following
Red
this is how it looks in a normal text-editor
(*VB[*)(RGBColor[1, 0, 0])(*,*)(*"1:eJxTTMoPSmNkYGAoZgESHvk5KRCeGJAIcndyzs/JLwouTyxJzghJzS3ISSxJTWMGyXMgyRcxgMEHeyiDgQHOAAALpBNd"*)(*]VB*)
this is how it looks in WLJS cell’s editor

An output expression
This is a special kind of syntax sugar, which basically provides an original expression and instructions editor on what to draw instead of it. Combining a lot of them together we can do some crazy stuff.
For instance, drag and drop your favorite image or capture them from your web camera as it is shown below

Take a picture!
Let us go step by step. An imported image in the cell looks like a single symbol
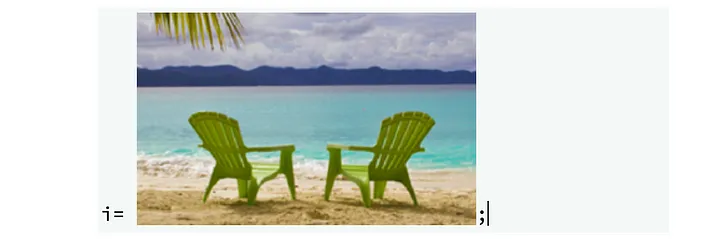
An entire image in the cell!
which we can assign to any other symbol and perform evaluation
i // ColorNegate
 Negated image in the cell as a result of the code above
or quickly analyze a color distribution in LAB color space
BubbleChart[
 Append @@@
  Tally[Round[
    Flatten[ImageData[ColorConvert[i, "LAB"]], 1][[All, {2, 3}]],
    10^-1]], ColorFunction -> (LABColor[.6, ##] &),
 ColorFunctionScaling -> False, BubbleSizes -> {0.01, 0.1}]
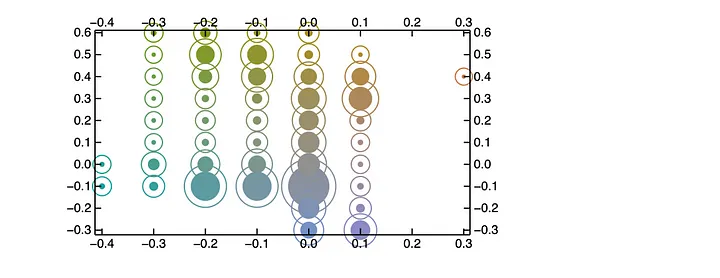
An output expression
Please, do not expose to the output very large images, we still did not optimize their rendering. Keep them in the symbols, and apply ImageResize[img, 300] if you want to preview the result.
To work with matrixes and vectors there is a special form
{{a,b}, {c,d}} // MatrixForm

An output expression
Or is it also possible to create matrixes using a special snippet from the command palette in the top bar
helper snippet for inserting matrixes
And it is still fine to work with it if it was a normal expression aka array of arrays
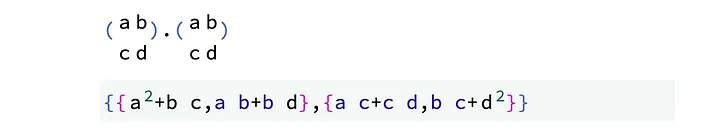
Matrix multiplication
Syntax sugar and decorations also serves the purpose of abstracting classical OOP objects providing a short summary
NumericArray[{1,2,3,4,5,6}]

Short summary
which is still a normal symbol, that can be copied somewhere else. For instance DateObject is rendered as a date
Now

Date object representation
Time-series has also its own representation
v = {2, 1, 6, 5, 7, 4};
t = {1, 2, 5, 10, 12, 15};

ts = TimeSeries[v, {t}]

Time series object can preview its time-dependency
And the last example of a syntax sugar is ListPlay, which is quite experimental, but allows to play or generate sound right in the notebook
ListPlay[Table[Sin[2 π 50 t], {t, 0, 1, 1./2000}]]

Sound object
If you have too much data to be stored in the cell, then turn it into an icon using Iconize
Table[i, {i, 100}] // Iconize

Iconized data
It uses zlib to compress it and store as BASE64 string inside the notebook. However, it the size does exceed a few kilobytes the data will be unloaded to a file and an icon will be turned into a seamless file reference.
Remember — this is still a normal expression, which can be copied, evaluated and etc. Sure a user can flex a lot by taking advantage of dynamic evaluation we will talk later…
Pointless, but cool illustration of object’s state
Dynamic evaluation and interactivity
We struggled to find a simple implementation of user interaction with an object and observing real-time recalculation of it in Jupyter-like notebooks. Why can’t it be as simple as in Mathematica, but as smooth as in Observable or Pluto? Indeed, it is hard to find a good balance. Here is our attempt at it
A combo of dynamic symbols and syntax sugar
Demonstration of user’s input and recalculated result
Demo code for dynamic Disk
The total number of lines of code needed to be written for the example above is two
define a symbol and attach it to a Disk as a radius using Offload wrapper
Graphics[Disk[{0,0}, Offload[radius]]]
define a slider and attach listener to it to update radius symbol
EventHandler[InputRange[0,1,0.1], Function[r, radius = r]]
It might look like a low-level programming, however, one can build on top of it higher-order helper structures and make it easier for specific tasks — a navigation gizmo for instance
 Gizmo navigator helper as a mix of GUI- and code-based graphics
At the demo above it looks like if it was hardcoded in Javascript, but actually it is nothing more than Wolfram Language. When a user drags this gizmo its coordinates flies to Wolfram Kernel running on a server, where it recalculates new dimensions for a cuboid and sends updated data back to the client, where THREE.js redraws new result at 60FPS.
More complexity
Please visit our page for more examples and deeper understanding of those techniques.
An ultimate test is of course - 3D graphics, where we usually have vertices and there are many of them
 Interactive FEM solving of a wave-equation
Again, this is not somewhat predefined method for drawing surfaces, but a regular symbol for representing polygons Polygon(triangles mostly) bounded to a dynamic symbol, where all vertices are stored
GraphicsComplex[allvertices // Offload, Polygon[triangles]], ...
There is a visible delay between input and response, since there is an obvious overhead coming from serializing numerical data to and from JSON. Which, we hope, can be solved in the future by using some binary format and passing it directly to the GPU.
However, there is no need in perfect 30–60FPS update rate, we can cheat and ask Javascript to interpolate between data portions.
In a case of 3D graphics, most calculations are done on GPU and only the positions of some objects or transformation matrixes are updated by Wolfram Kernel. For example — dynamic lighting
point = {1,1,1};

Graphics3D[{Shadows[True],
  Polygon[{{-5, 5, -1}, {5, 5, -1}, {5, -5, -1}, {-5, -5, -1}}], White,
  Cuboid[{-1, -1, -1}, {1, 1, 1}], Shadows[False],
  PointLight[Red, {1.5075, 4.1557, 2.6129}, 100],
  Shadows[True], SpotLight[Cyan, point // Offload]

  EventHandler[Sphere[point, 0.1], {
    "transform" -> Function[assoc, point = assoc["position"]]
  }]

}, "Lighting" -> None]

The resulting image
a user controls only the target position of a spot light, the rest is done using THREE.js and WebGL.
Here’s another example involving animation, continuous construction, and destruction of many objects on the canvas
On the animation above Disk symbols are added dynamically with variable radiuses. Since it is not a raster plot, but SVG container, there are some tricks made to reuse objects from so-called objects pool instead of creating new dynamic variables and other meta-data for each new disk created. There are many details regarding the animation, but the key thing is in the following lines of the demo code
cell 1
Graphics[{
  White,
  EventHandler[Rectangle[{-1,-1}, {1,1}], {"mousemove"->handler}],
  MetaMarker["canvas"]
}, ImagePadding->None]
So what we have here: invisibleRectangle with attached listener to track the mouse position and sort-of UID "canvas" used by selectors later. The second key line is a definition of a handler function
cell 2
With[{win = CurrentWindow[]},

  handler = Function[xy,
    FrontSubmit[{

      Hue[RandomReal[{0,1}], 1,1],
      Disk[xy, RandomReal[{0.01,0.1}]]

    }, MetaMarker["canvas"], "Window"->win]
  ];

];
where it just “submit” or append new rectangles to an existing canvas using our selector "canvas" . It again violates the paradigm of immutable state, however, if you close your eyes and imagine AppendTo instead of FrontSubmit it might resolve your cognitive contradiction or might not.
One cell — many languages
What if we want to style our expressions using Tailwind CSS? Sure WLX is available right from there
ℹ Wolfram Language XML (WLX) is a superset over Wolfram Language and XML allowing to write complicated layout and perform computations as well
Create a new cell and then type
.wlx

LeakyModule[{
  SliderItem = InputRange[0.1, 1, 0.05, 0.1],
  symbol = 0.1
},

  EventHandler[SliderItem, Function[value, symbol = value]];

  With[{
    Widget = Graphics[{
      Green, Disk[{0,0}, symbol // Offload], Pink,
      Rotate[Rectangle[{-1,-1}, {1,1}], 3.14 symbol // Offload]
    }, Controls->False]
  },
  <div class="divide-y divide-gray-200 overflow-hidden rounded-lg bg-white shadow">
    <div class="px-2 py-3 sm:p-6">
      <Widget/>
    </div>
    <div class="px-2 py-2 sm:px-6">
      <SliderItem/>
    </div>
  </div>
  ]
]
Output cell result
There are no dropdown menus, all you need is to specify an “extension” in the first line of your cell. Think about it if it is an anonymous file
.md
# Markdown
By typing `.md` in the beginning of a cell, it switches to Markdown mode. Markdown mode supports an HTML insets as well

Output cell result
And each editor like this supports drag and drop file uploads.
Javascript is of course available as well
.js
// written by GPT4
const canvas = document.createElement('canvas');
const ctx = canvas.getContext('2d');

// Set canvas size
canvas.width = window.innerWidth * 0.8;
canvas.height = window.innerHeight * 0.8;

let gradientAngle = 0;
let animationFrameId;

function draw() {
    ctx.clearRect(0, 0, canvas.width, canvas.height);

    // Create gradient
    const gradient = ctx.createLinearGradient(
        0,
        0,
        canvas.width * Math.cos(gradientAngle),
        canvas.height * Math.sin(gradientAngle)
    );

    gradient.addColorStop(0, 'red');
    gradient.addColorStop(0.5, 'blue');
    gradient.addColorStop(1, 'green');

    ctx.fillStyle = gradient;

    // Draw a circle that moves
    let x = canvas.width / 2 + (Math.sin(Date.now() / 1000) * canvas.width / 4);
    let y = canvas.height / 2 + (Math.cos(Date.now() / 1000) * canvas.height / 4);
    ctx.beginPath();
    ctx.arc(x, y, 100, 0, Math.PI * 2);
    ctx.fill();

    gradientAngle += 0.01;

    animationFrameId = requestAnimationFrame(draw);
}

// Handle cell destruction
this.ondestroy = () => {
    cancelAnimationFrame(animationFrameId);
};

// Start the animation
draw();

return canvas;

GPT4 answer for a beautiful Javascript demo printed into our notebook
Mermaid diagrams are also available
.mermaid

graph LR
    A[Square Rect] -- Link text --> B((Circle))
    A --> C(Round Rect)
    B --> D{Rhombus}
    C --> D
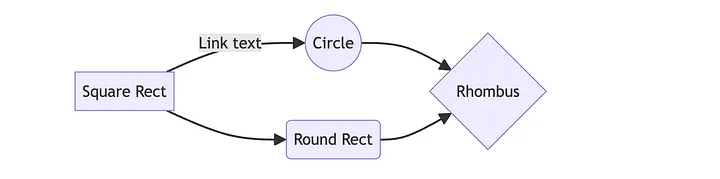
Output cell result
Since the first line in the cell already looks like a file extension, why not just print the content of a file if there is no other cell processors found..?
randompic.jpeg
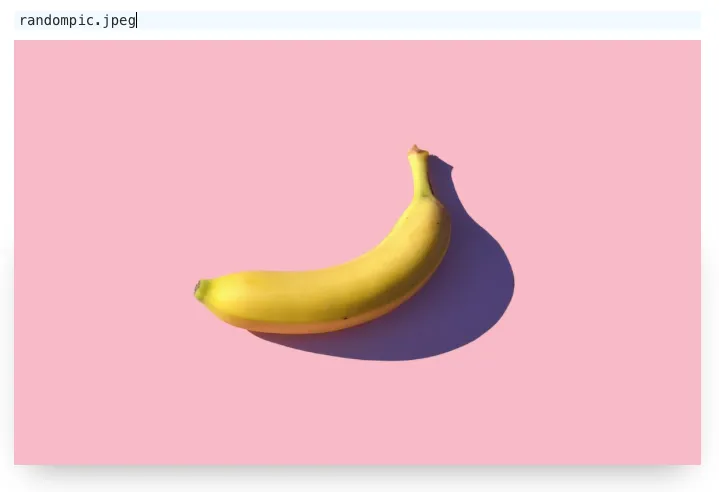
An output cell for an image file
We can go even further and create a file directly from the cell
filename.txt
Hello World
and then read it back
filename.txt

Input and output cells of the code above
Combining its power with Javascript
Create a new cell with the following content
.js

core.ReadClipboard = async () => {
  const clipText = await navigator.clipboard.readText();
  return clipText;
}
Any Javascript function defined like this is also valid Wolfram Expression, which can be called from a normal cell
FrontFetch[ReadClipboard[]] // Print
It will evaluate our Javascript function on the frontend, fetch the result and print it to a log. The great thing about Javascript, that we can have easy access to almost all periphery of our device
 Web-camera snippet written in a mix of WL and JS
Web-camera or microphone or GPU can be accessed and the data can also be piped in all directions using different methods. But as an unwritten rule for Javascript → WL direction we rely on an event-based approach
cell 1
.js

const interval = setInterval(() => {
  server.kernel.emitt('test', '"Hello World!"');
}, 1000);

this.ondestroy = () => cancelInterval(interval);

return '';
while on Wolfram Kernel’s side
cell 2
EventHandler["test", Print];
Making data-driven slides
What is data-driven? It means you process your data, plot graphs and they are directly rendered on a slide. When data changes, your slides will be always up to date. And not even mentioning the interactivity which comes as a nice side-effect from our notebook architecture
3D graphics, interactivity LIVE on your slides
Working in academia, I (me — Kirill Vasin) have never been fond of preparing presentations for talks, where a large portion of time is spent on visual execution rather than the content itself. Why is that? Let me explain:
- Data processing is done using environment A.
- Visualization is done using environment B.
- Slides are created using environment C.
Data transfer between these environments is achieved through serialization to a file, which, let’s say, is not very fast or convenient. Oh, and let’s not forget about:
- Dragging blocks of information / copying them to other slides.
In the open-source community, there are already solutions for this, such as RevealJS with the ability to write slides in Markdown. However, there’s still a lack of components and, specifically, a embedding 3D/2D graphics form the notebook.
Markdown supports HTML out of the box, meaning we already have access to styles and formatting if desired. Then why not to hybridize it with WLX? For instance, if we want two-columns layout
cell 1 — component definition
.wlx

Columns[Cols__] := Columns[List[Cols]]
Columns[Cols_]  := With[{
  number = Length[Cols],
  Layout = Table[<div><Item/></div>, {Item, Cols}]
},
    <div class="columns-{number}">
        <Layout/>
    </div>
];
cell 2 — actual slide
.slide

# Title of a slide

<Columns>
  <div>

Hello Dolly

  </div>
  <div>

Hello World

  </div>
</Columns>
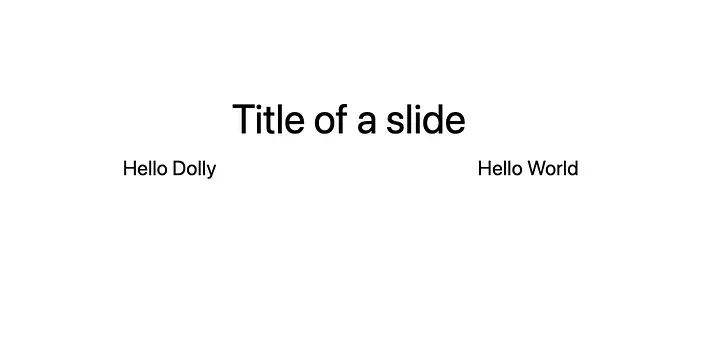
Output cell
Before we said data-driven, let’s bring some data
cell 1
Figure = SphericalPlot3D[SphericalHarmonicY[2,0, t,p], {t, 0, Pi}, {p, 0, 2Pi}];
cell 2
.slide

# Embed some figures
Even 3D

<div style="text-align: center; display: inline-flex;">
  <Figure/>
</div>

Try to move it using your mouse
An output cell example
WLX recognizes tags starting with a capital letter as WL expressions, the rest is treated as regular HTML tags.
If we want to merge all slides into a single presentation, simple type
.slides
(plural)
Luckily RevealJS already comes with a framework for animations and transitions, so we do not have to invent our own
    .slide

# Slide

Fragment disapear <!-- .element: class="fragment fade-out" data-fragment-index="1" -->

Fragment appear <!-- .element: class="fragment" data-fragment-index="2" -->

Fragment changes the color <!-- .element: class="fragment highlight-red" data-fragment-index="3" -->
To couple Wolfram Language Kernel and slides, there is special function used to capture events from the slide allowing us to make procedural animations
Animated spin structure on a slide
On the example above we placed graphics component in the center, where arrows are coupled to dynamic symbols. They are updated with new values once one of the fragments has been revealed on the slide.
Please see our documentation page for more examples
No one stops us from putting a giant Graphics component as a background image, where we can animate objects
Fully animated background on a slide
Portability
The origins of WLJS Notebook are coming from a struggle to display 3D structure of a crystal on a college’s PC, that does have an access to public clouds. Back at the time in 2018 an existing solution — Wolfram Cloud was quite far from rendering 3D graphics correctly. Therefore WLJS Notebook targets to embed and to bring to life as much as possible inside a single .html file
Working 3D graphics opened in Safari
To reproduce this example on the GIF above, create a new notebook, add a couple of cells like these ones below and evaluate them
Plot[Sinc[x], {x,-10,10}]

ExampleData[{"Geometry3D", "KleinBottle"}]
Then it is important to save the notebook (it will collect all necessary data) and then export it a standalone HTML file using a button in the top-bar

A button to export
This feature does not only export a notebook to a portable format, it brings and compresses all external pictures, raw data stored in the notebook, essential Javascript code for rendering it into a bulky .html file (10–15 mB). However, CDN is also an option.
In general it makes sure
you do not need anything installed and even internet connection to view notebooks
.html file can be opened using WLJS Notebook and unpacked back to a normal editable notebook with all raw data included
your presentations will also work correctly (if no event handling is involved on a server)
It does not rely on binary formats, instead everything is stored using JSON-like format and in theory is trackable by git-like systems. Even OpenAI’s GPT-4o can parse the content of the notebook at ease!
An example of OpenAI’s GPT-4o parsing WLJS Notebook
Bonus: AI Assistant
It might seem like joining the hype at first glance, the capabilities of AI are here is a quite unique. With read-write access to the data in cells and up to 3500 tokens of public documentation, WLJS Notebook provides an experience like to having a copilot working alongside you.
 GPT4 reads and fixes errors in the cells without asking a user
Try to ask
- “fix my errors and apply changes to the cell”
- “make a dynamic plot with a point that follows a cursor”
- “show me something cool in Javascript!”
It is aware of dynamic features, of how to output a DOM element in Javascript cell, what language is used in the current cell and so on. However it still not perfect and can be considered as experimental feature.
Technology stack
The overall concept of WLJS Notebook is shown below
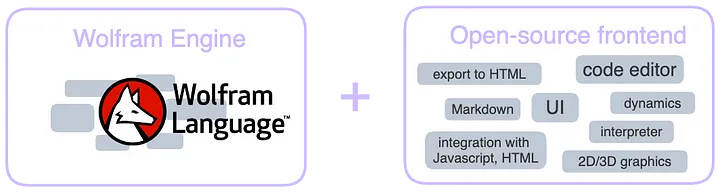 General concept
For the real-time communication it uses WebSockets and a simple HTTP protocol for server-side page rendering.
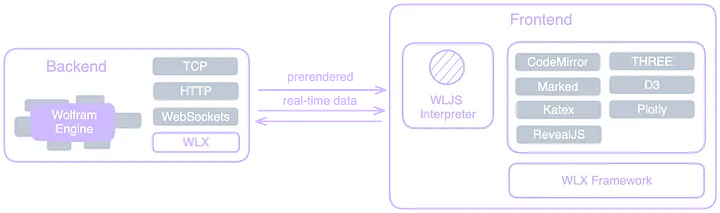
App’s architecture
For generating pages it adopts WLX (Wolfram Language XML) framework similar to JSX — WLX, allowing to enforce component approach and maintain functional blocks of a page or widgets as regular WL expressions. Pre-rendered pages (SSR) are sent via the HTTP protocol to the client’s application (usually a browser), where interface elements and data are bound to the server via WebSockets.
On the frontend a tiny Wolfram Language Interpreter is running, which serves all needs of UI, data synchronization, even partial calculations, and dynamics. Of course it heavily interacts with Javascript libraries such as CodeMirror 6 to create cells, Marked, THREE, D3 and others for displaying the results.
How does it differ from Mathematica
This platform closely mirrors the key features of Wolfram Mathematica, utilizing its standard library. Here are the primary distinctions:
- Open-source and built upon the freeware Wolfram Engine.
- Offers faster, but much more limited dynamics.
- Deeply integrated with JavaScript for enhanced functionality.
- Works as a desktop application or on a server.
- No software installation required to view notebooks.
- Operates independently of online services or Wolfram Research APIs (and on the internet in general).
No all Mathematica’s functions are implemented in WLJS Notebook, please check our documentation (Reference section).
We aim for our contribution to open-source notebooks to address the needs of scientists, particularly physicists or mathematicians who may not primarily identify as programmers. Our goal is to assist them in preparing presentations, creating interactive widgets, and utilizing standard mathematical equations more seamlessly within the notebook environment.
Thank you for your attention
UPD 25.Jun.2024: Introduction corrections


