Often of interest are stochastic processes with absorbing boundaries (states). However, Mathematica does not natively include functionality to deal with absorption.
In one spatial dimension there is a nice solution: prior solution
Yet, I'm considering a situation where the process evolves with absorbing boundaries in multiple dimensions. In particular, I'm considering a regular simplex. If the process hits a boundary it cannot leave but continues to evolve until it hits a vertex.
The method I'm using is indicator functions that stop the dynamics in certain dimensions when a boundary is crossed. It works well for boundaries aligned with Cartesian coordinates, but is verbose otherwise; particularly, considering I want to scale this to higher dimension simplices. The pictures below illustrate.
ClearAll["Global`*"]
\[Theta] = .50;
\[Mu] = {1, 2};
\[Eta] = 4.;
dim = 2;
Tmax = 10.;
dt = .1;
xs = Table[Subscript[x, i], {i, dim}];
xts = Map[(#[t] &), xs];
wprocs =
Table[Subscript[w, i] \[Distributed] WienerProcess[], {i, dim}];
\[CapitalOmega] =
ImplicitRegion[
Evaluate[Total[xs] <= \[Eta] \[And] Apply[And, Thread[xs >= 0]]],
Evaluate[xs]];
eqs = Table[\[DifferentialD](Subscript[x, i][
t]) == (\[Theta] (\[Mu][[i]] -
Subscript[x, i][
t]) \[DifferentialD](t) + \[DifferentialD](Subscript[w, i][
t]))*UnitStep[
Subscript[x, i][t] (\[Eta] - Subscript[x, i][t])], {i, dim}];
proc = ItoProcess[eqs, xts, {xs, RandomPoint[\[CapitalOmega]]}, t,
wprocs];
paths = Clip[RandomFunction[proc, {0, Tmax, dt}], {0, \[Eta]}];
trad = ({#2[[1]], #2[[2]], #1} &) @@@ Flatten[paths["Paths"], 1];
regionPlot =
RegionPlot3D[
Total[{x1, x2}] <= \[Eta] && x1 >= 0 && x2 >= 0, {x1,
0, \[Eta]}, {x2, 0, \[Eta]}, {t, 0, Tmax},
PlotStyle -> Directive[Opacity[0.05], Blue],
Mesh -> None, Boxed -> False, AxesLabel -> {"x1", "x2", "Time"},
PlotRange -> {{0, \[Eta]}, {0, \[Eta]}, {0, Tmax}},
PlotTheme -> "Scientific"];
trajectoryPlot =
ListLinePlot3D[trad, PlotTheme -> "Scientific",
BoxRatios -> {1, 1, GoldenRatio}, PlotStyle -> {Orange, Thick}];
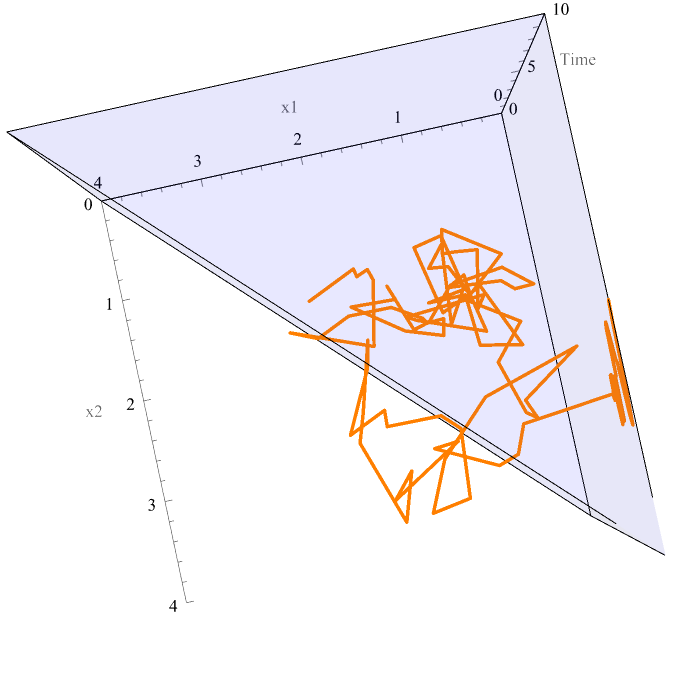
Show[regionPlot, trajectoryPlot]
Desired behaviour: 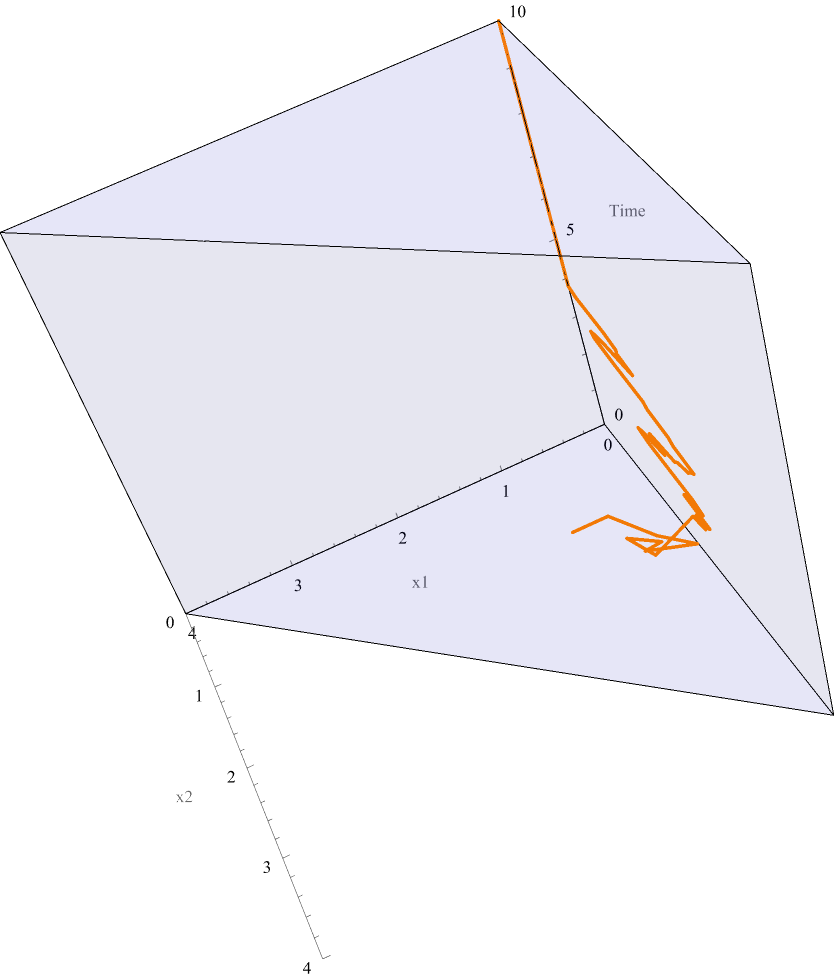
Undesired behaviour: