Group Abstract Group Abstract

Message Boards Message Boards

0
|
4.2K Views
|
3 Replies
|
3 Total Likes
View groups...
Share
Share this post:

Sinusoidal regression on dataset

Posted 1 year ago

Tried NonlinearModelFit, TimeSeriesModelFit, FourierSeries

Have a dataset of daily temperatures for 10 years, need a sinusoidal expression representing it. I'm not sure if it's syntax errors or what, but none of the three above methods have worked. I've tried multiple times with each and none of them give me a function, best fit parameters, or even show up on a graph. Any tips would be appreciated.

POSTED BY: Jen Granato
3 Replies

It can be done as follows:

years = 18;
data = QuantityMagnitude@
   Normal[WeatherData["Philadelphia", 
      "MeanTemperature", {{2007, 1, 1}, {2006 + years, 12, 31}, 
       "Day"}]][[All, 2]];
model = a Sin[b t + c] + d;
fittedModel = 
  NonlinearModelFit[data, {model, Abs[b] <= 1/24}, {a, b, c, d}, t];
ListPlot[data, PlotStyle -> Blue, PlotRange -> All, 
 AxesLabel -> {"Time (days)", "Temperature (°C)"}, 
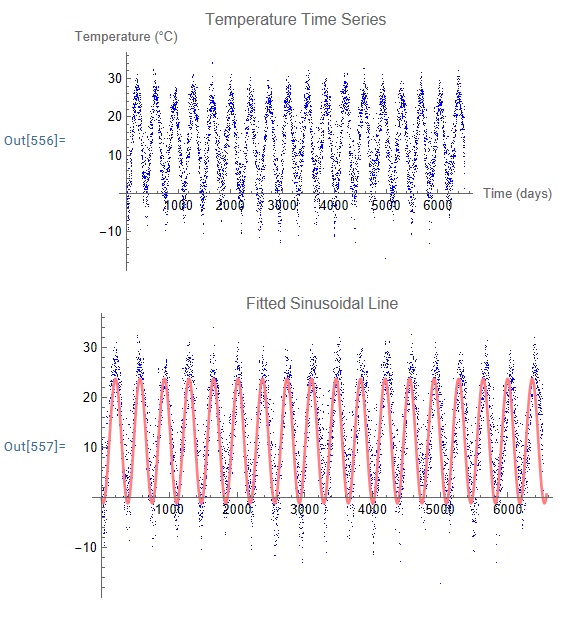
 PlotLabel -> "Temperature Time Series"]
Show[ListPlot[data, PlotStyle -> Blue], 
 Plot[fittedModel[t], {t, 1, 365*years}, PlotStyle -> Pink], 
 PlotLabel -> "Fitted Sinusoidal Line"]

The graph looks like this: enter image description here
Attachments:
Posted 1 year ago

It would be help (in fact, essential) that you produce the code you used for at least NonlinearModelFit.

Generally when fitting sine waves to data with NonlinearModelFit, there needs to be a reasonable guess at the parameter representing the frequency of the sine wave. The default starting value is 1 for all parameters if you don't give starting values.

If your model is a simple sine wave and the time values are in days, then using 2 Pi/365 will likely be a good starting value for the frequency parameter.

POSTED BY: Jim Baldwin
Posted 1 year ago
POSTED BY: Bill Nelson
Reply to this discussion
Community posts can be styled and formatted using the Markdown syntax.
Reply Preview
Attachments
Remove
or Discard
