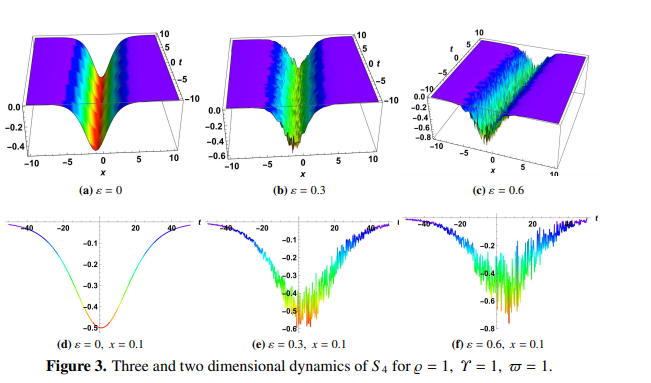
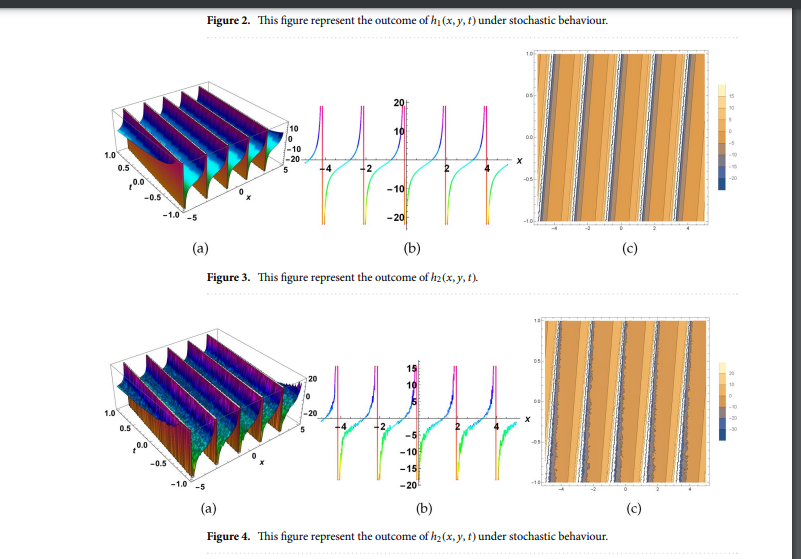
I want to plot a function that I solved using my method, but I am struggling to show the effect of the Wiener process (also known as Brownian motion) in the graph. Specifically, I am unable to plot the graph in a way that clearly demonstrates the impact of noise. Does anyone have an idea of how I can achieve this? Any suggestions would greatly strengthen my paper. 

