I would like to determine the parts of a model that are consuming the most CPU. To do this I have tried putting a counter into parts of the Modelica code, as shown in the example below:
model counter
  discrete Integer[3] counter(each start = 0, each fixed = true);
  Real y;
equation
  if (time >= 0 and time < 5) then
    counter[1] = pre(counter[1]) + 1;
    counter[2] = pre(counter[2]);
    counter[3] = pre(counter[3]);
    y = 2 * time + 10;
  elseif (time >= 5 and time < 10) then
    counter[1] = pre(counter[1]);
    counter[2] = pre(counter[2]) + 1;
    counter[3] = pre(counter[3]);
    y = 3 * time + 20;
  else
    counter[1] = pre(counter[1]);
    counter[2] = pre(counter[2]);
    counter[3] = pre(counter[3]) + 1;
    y = 5 * time;
  end if;
end counter;
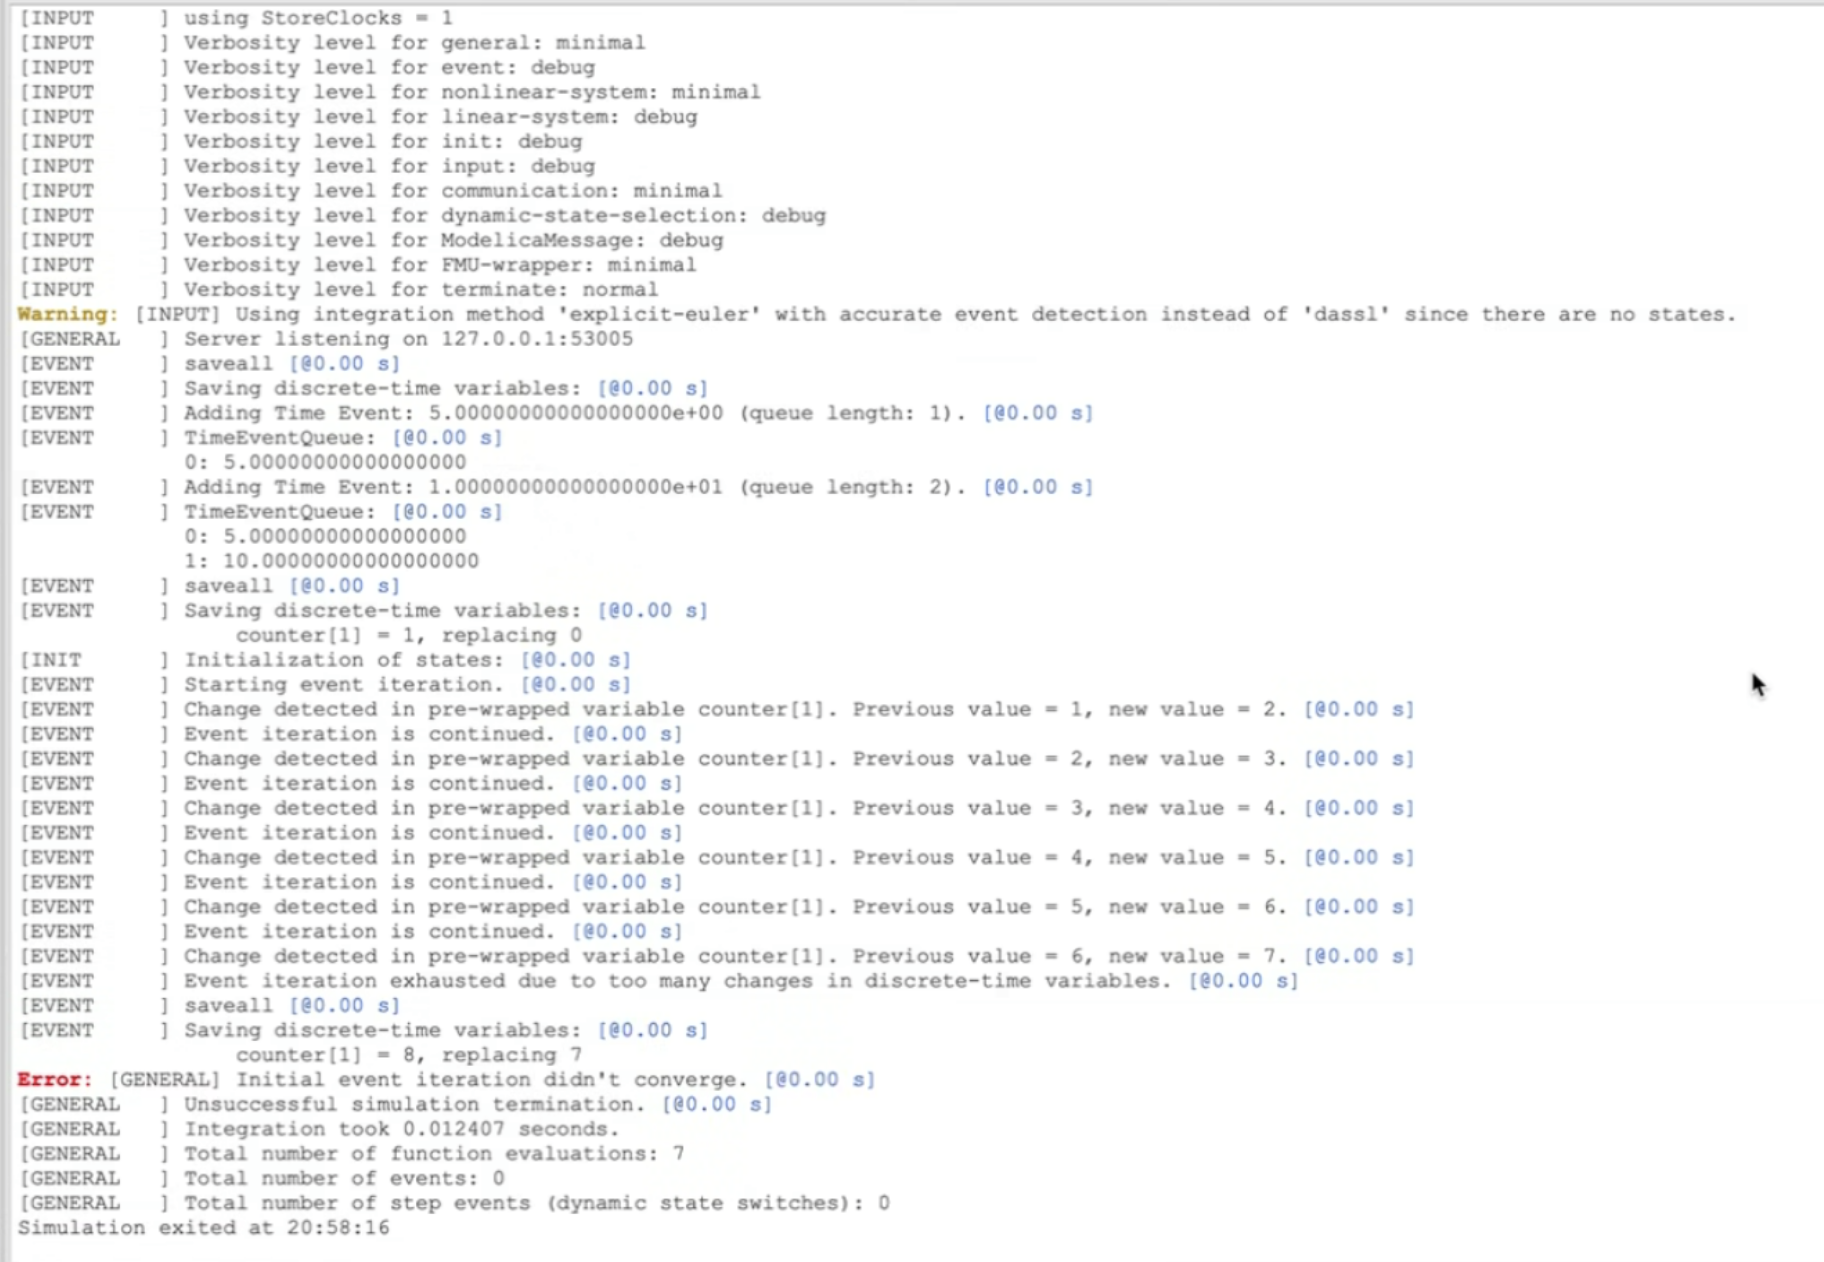
As you can see in the 'Simulation Log' screenshot, Simulation Center generates an error after initialization (and presumably during integration) at time = 0. Can someone explain what it is happening and why? For example, why was counter[1]=pre(counter[1])+1 evaluated 7 times before the Error was generated?
And, if the approach above won't work, is there another way of counting how many times a branch of a conditional statement is executed during a simulation.