Group Abstract Group Abstract

Message Boards Message Boards

0
|
185 Views
|
2 Replies
|
1 Total Like
View groups...
Share
Share this post:

How to move axes labels to the left and bottom in a Mathematica Plot

Posted 1 day ago
Plot[x^2, {x, -3, 3}, AxesLabel -> {"x", "y"}, 
 AxesStyle -> Arrowheads@0.035]

enter image description here

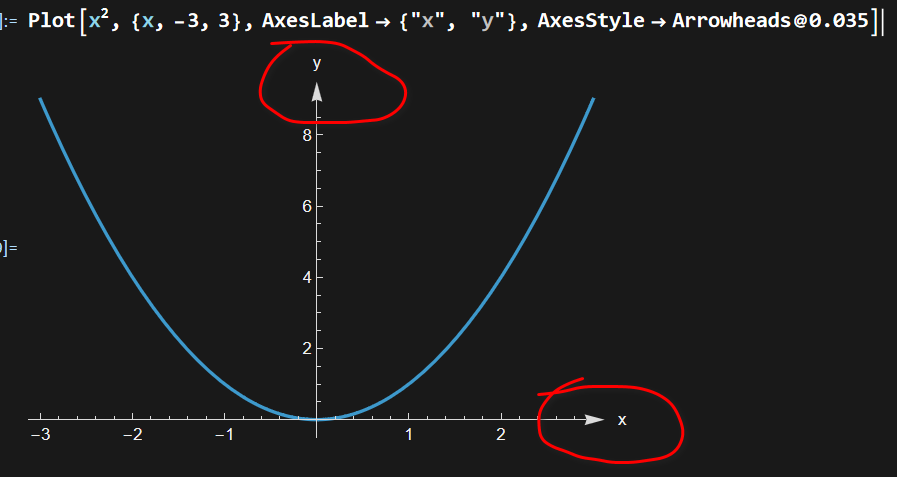
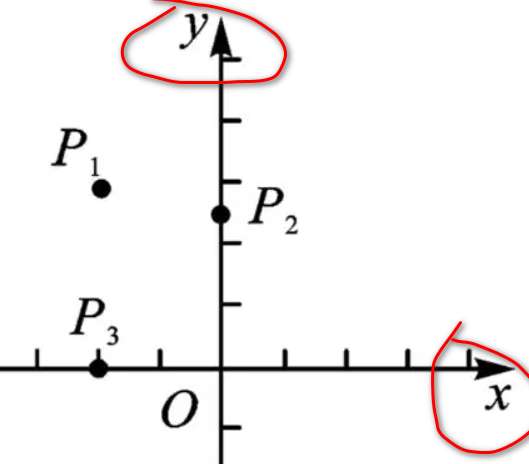
Using the code above, the labels of the Cartesian coordinate system are positioned such that the x-axis label 'x' is to the right of the arrow on the x-axis, and the y-axis label 'y' is above the arrow on the y-axis. How can the code be modified so that the labels appear as shown in the figure below, with the x-axis label 'x' positioned below the arrow and the y-axis label 'y' positioned to the left of the arrow?

enter image description here

POSTED BY: Wen Dao
2 Replies
Posted 7 hours ago

Here is a horrible way to do almost what you want. (Gianluca Gorni's way is the way to go.)

Labeled[Plot[x^2, {x, -3, 3}, AxesStyle -> Arrowheads@0.035],
 {"x", "y" <> "      "}, {{Bottom, Right}, {Top, Center}}]

Plot with placed axis labels

POSTED BY: Jim Baldwin

The only workaround that I know about is to place the labels manually:

Plot[x^2, {x, -3, 3}, Epilog -> {Text["x", Scaled[{1, 0}], {2, -1}]}, 
 AxesStyle -> Arrowheads@0.035]
POSTED BY: Gianluca Gorni
Reply to this discussion
Community posts can be styled and formatted using the Markdown syntax.
Reply Preview
Attachments
Remove
or Discard