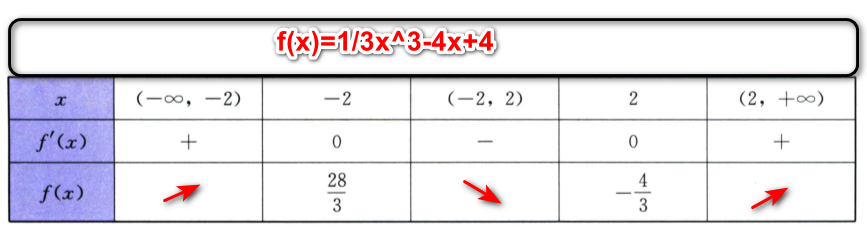
I want the code to implement the following functionality: When a function and its domain interval are supplied, it should generate a table with
Row 1: the name of the function
Row 2: the interval subdivisions (rendering −∞ and +∞ with the usual mathematical glyphs) and the zeros of the first derivative that fall inside them
Row 3: the sign of the derivative in every sub-interval (+ for positive, − for negative, 0 at critical points)
Row 4: the monotonicity (↑ for increasing, ↓ for decreasing) and, directly below each critical point, the value of the original function at that point
The expected table that the code should generate is as shown in the figure below:
The interval types to support are: Both endpoints are finite real numbers The entire real line (−∞, +∞) (−∞, b] where b is finite [a, +∞) where a is finite The current implementation only works correctly but also missing one feature for case 1 (finite endpoints).
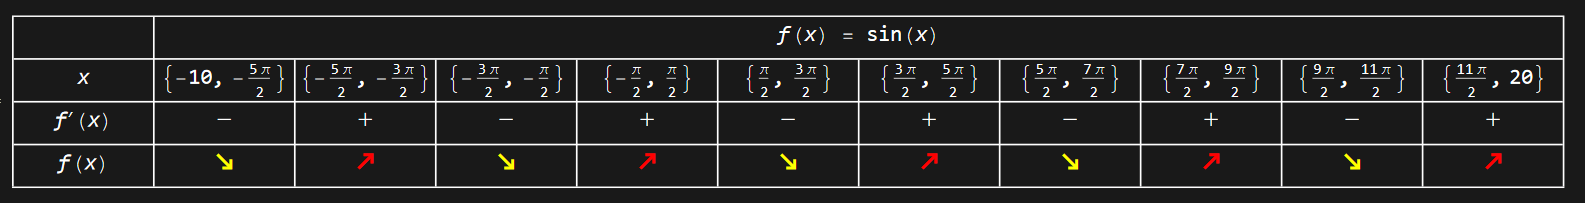
Example that works: melody[Sin@x, x, {-10, 20}].
 Known bugs / missing features:
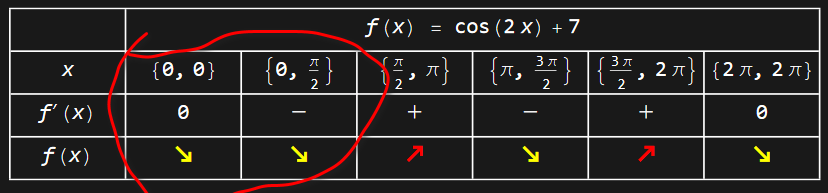
melody[Cos[2 x] + 7, x, {0, 2 π}] produces two identical monotonicity columns that are not merged
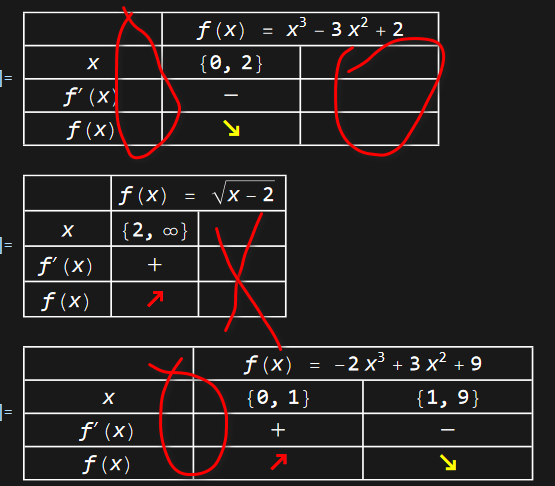
melody[x^3 - 3 x^2 + 2, x] does not show the left-most (−∞, …) or right-most (…, +∞) intervals
melody[Sqrt[x - 2], x, {2, Infinity}] generates extra blank columns
melody[-2 x^3 + 3 x^2 + 9, x, {-Infinity, 9}] fails to display the interval starting from −∞
There is one common element missing in every run:
In row 2, the x-coordinates of all derivative zeros that lie inside the interval;
In row 3, the derivative value 0 at those zeros;
In row 4, the value of the original function evaluated at those zeros.
How should the code be modified to satisfy all the requirements above?
The expected table that the code should generate is as shown in the figure below:
PS:
If the function is defined at the endpoints of the given interval, the table should also display:
the endpoint x-values,
the corresponding derivative values, and the original function values at those points.
melody[func_, sym : _Symbol : x,
  intvl : _List : {-Infinity, Infinity}] :=
 Module[{df, crpt, int, arg}, df = D[func, sym];
  crpt =
   SolveValues[{df == 0,
      If[intvl === {-Infinity, Infinity}, sym \[Element] Reals,
       If[intvl[[1]] === -Infinity, sym < intvl[[2]],
        If[intvl[[2]] === Infinity, sym > intvl[[1]],
         intvl[[1]] <= sym <= intvl[[2]]]]]}, sym] // Union;
  If[crpt === {}, crpt = {}];
  int = Partition[
    Flatten@{If[intvl[[1]] === -Infinity, Nothing, intvl[[1]]], crpt,
      If[intvl[[2]] === Infinity, Nothing, intvl[[2]]]}, 2, 1];
  If[int === {}, int = {{intvl[[1]], intvl[[2]]}}];
  arg = int /. {{-Infinity, lb_} :> lb - 1, {ub_, Infinity} :>
      ub + 1, {a_, b_} :> (a + b)/2};
  {{"", StringForm["`` = ``", TraditionalForm@HoldForm[f[x]],
      TraditionalForm[func /. sym -> x]], SpanFromLeft},
    Prepend[int, TraditionalForm@x],
    Prepend[((df /. sym -> #) & /@ arg) /. {_?Positive ->
        Style["+", 20], _?Negative -> Style["-", 20]},
     TraditionalForm@HoldForm[f'[x]]],
    Prepend[If[# > 0, Style["\[UpperRightArrow]", 20, Red, Bold],
        Style["\[LowerRightArrow]", 20, Yellow,
         Bold]] & /@ (df /. sym -> # & /@ arg),
     TraditionalForm@HoldForm[f[x]]]} //
   Grid[#, Frame -> All, ItemSize -> All] &]


melody[Sin@x, x, {-10, 20}]
melody[Cos[2 x] + 7, x, {0, 2 \[Pi]}]
melody[x^3 - 3 x^2 + 2, x]
melody[Sqrt[x - 2], x, {2, Infinity}]
melody[-2 x^3 + 3 x^2 + 9, x, {-Infinity, 9}]


