When you post a Notebook containing figures (PNGs) in a Wolfram community post, the display quality is significantly reduced and the lines are jagged as if with very low resolution even if in the desktop Notebook the quality is very good. Any hint on how to improve the quality of the pictures displayed?
I will now do some test in this post to reproduce the problem.
If I insert the figures directly in the post, the quality is good: 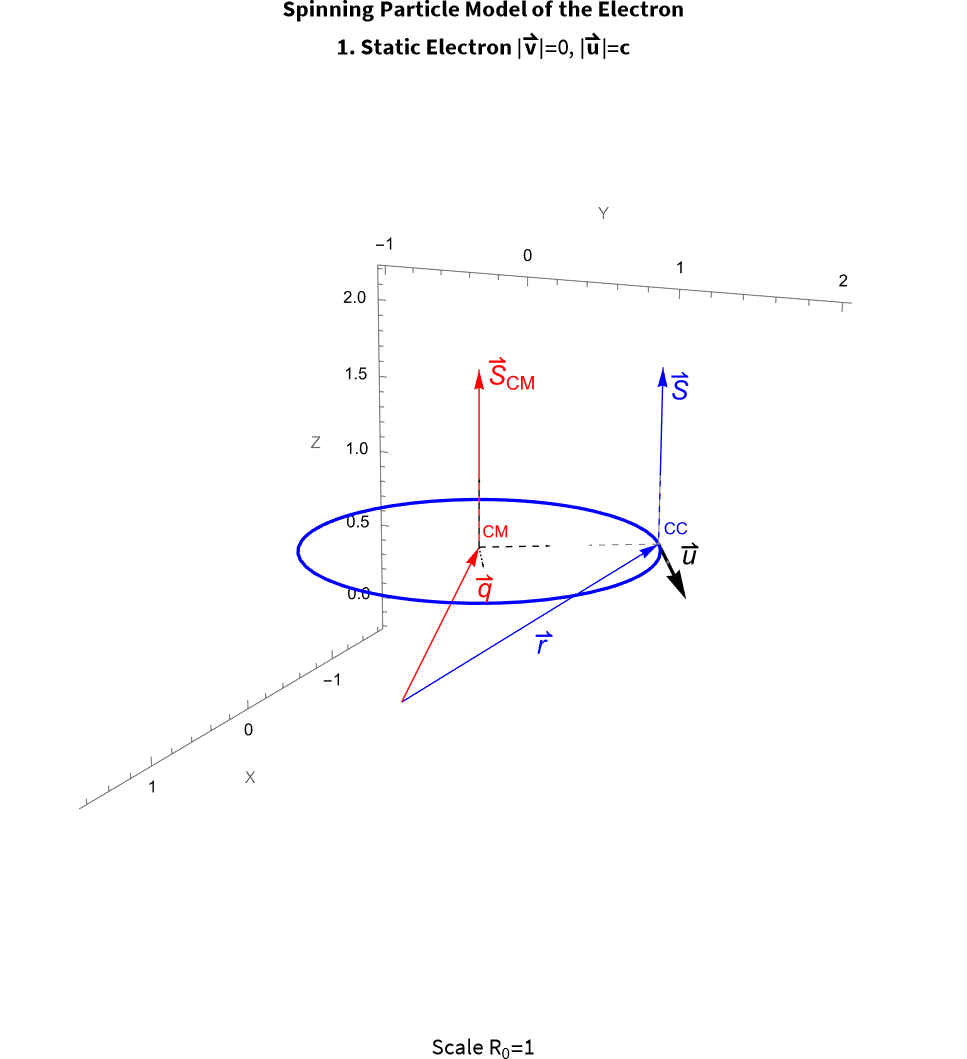
But if I use Add Notebook to insert the Notebook with the same picture, the lines are jagged:
So, the only solution I see to have a good display in the Wolfram Community would be to split the Notebook in many smaller Notebooks each time you have a figure in your Notebook and insert the pictures manually in the post or using HTML. But this seems like an absurd effort....
then introduce manually the pictures, (which if there are several, you cannot insert as a table in the post, but even a screenshot has better quality than if the pictures are included in the Notebook): 
And then the Add Notebook with second part of the Notebook:
Sample equation as code Sample, why isn't it displayed as in the Notebook?
\[DifferentialD]Overscript[v, \[RightVector]]/\[DifferentialD]t=(\[DifferentialD]^2/\[DifferentialD]t^2)Overscript[q, \[RightVector]]=e/(m \[Gamma](v)) (Overscript[E, \[RightVector]]+Overscript[u, \[RightVector]] *Overscript[B, \[RightVector]]-1/c^2 Overscript[v, \[RightVector]]((Overscript[E, \[RightVector]]+Overscript[u, \[RightVector]] *Overscript[B, \[RightVector]])Overscript[v, \[RightVector]]))
Any guidance will be most welcome.
 Attachments:


