Group Abstract Group Abstract

Message Boards Message Boards

0
|
741 Views
|
4 Replies
|
3 Total Likes
View groups...
Share
Share this post:

Automatically scale labels based on image size

Posted 4 months ago

Jupyter screenshot for the following Mathematica code is shown alongside python analogue. The latter scales axes' labels and plot thickness, not the former: is there a Plot[] option for that?

SetOptions[Plot,
  Background -> GrayLevel[0.95],
  AxesStyle -> Black,
  LabelStyle -> Black
];

Plot[Sin[x], {x, 0, 10},ImageSize->100]

jupyter screenshot

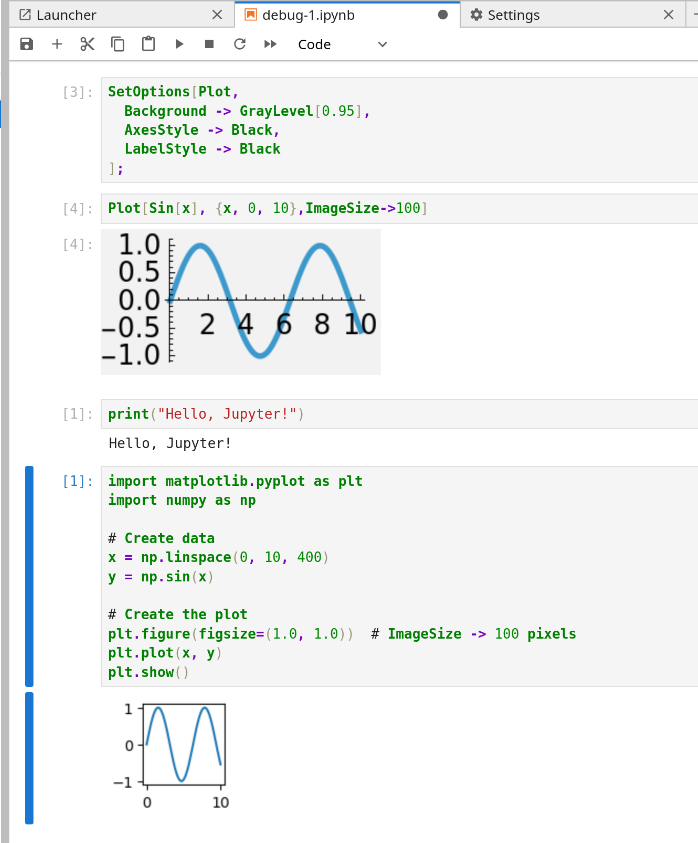
P.S. : The reason for SetOptions is the default background is black. Is that a new thing?

POSTED BY: Erwann Rogard
4 Replies
Posted 4 months ago

It seems that the Jupyter front end differs from that of Mathematica. The below is from plain MMA:

enter image description here

POSTED BY: Hans Milton
Posted 4 months ago

It was a wrong assumption of mine that matplotlib automatically scales labels' size and thickness. Here's additional insight about specified/actual image size, and evidence of "background is black". This is all after restarting the kernel:

g=Plot[
  Sin[x],
  {x, 0, 10},
  ImageSize -> 100,
  TicksStyle -> Scaled[.005],
  PlotStyle  -> Thickness[.01]
];
{ImageDimensions[g],ImageSize /. Options[g]}

Show[g]

jupyter screenshot

POSTED BY: Erwann Rogard
Posted 4 months ago
POSTED BY: Eric Rimbey
Posted 4 months ago
POSTED BY: Eric Rimbey
Reply to this discussion
Community posts can be styled and formatted using the Markdown syntax.
Reply Preview
Attachments
Remove
or Discard