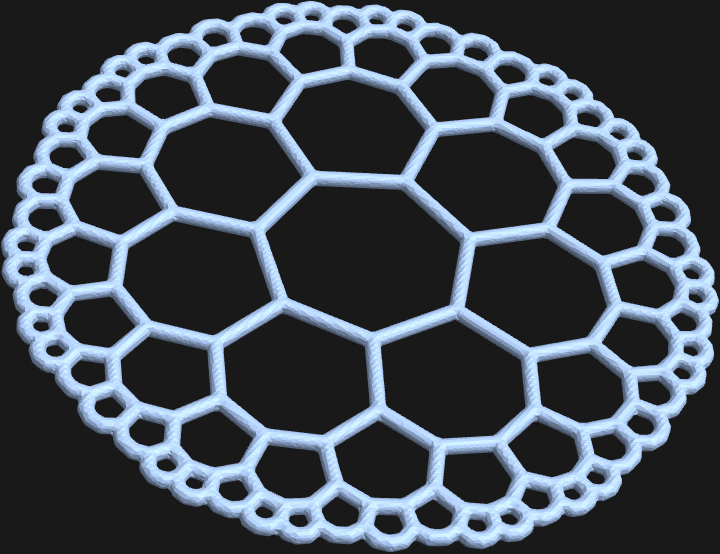
The first graphic is from a notebook many years old, and the second is from the latest version of Mathematica. What's going on?
Is this a known regression in functionality?

n = 7; m = 3; dt = 2 Pi/n; dtm = 2 Pi/m; r =
 1./(1 - Sin[dt/2]/Cos[dtm/2]); R = 1. r Cos[(dt + dtm)/2]/Cos[dtm/2];
ToMatrix[z_,
   r_] := (I/r) {{z, r^2 - z Conjugate[z]}, {1, -Conjugate[z]}};
alist = Table[
  ToMatrix[r Exp[I t], r - 1], {t, dt/2, 2 Pi, dt}]; Tlist =
 Join[{IdentityMatrix[2]}, alist];
homography[{{a_, b_}, {c_, d_}}, z_] := (a z + b)/(c z + d);
FindT[T0_, Tlist_] :=
  MemberQ[Tlist,
   T_ /; Abs[homography[T, 0] - homography[T0, 0]] < 1.0*^-3];
i2 = 1; Do[i1 = i2 + 1; i2 = Length[Tlist];
 Do[Scan[(T = Tlist[[i]] . #;
     If[! FindT[T, Tlist], Tlist = Append[Tlist, T]]) &, alist], {i,
   i1, i2}], {2}];
plot = Show[
  Graphics[
   Map[Line[
      Table[z = homography[#, R Exp[I t]]; {Re[z], Im[z]}, {t, 0,
        2 Pi, dt}]] &, Tlist], AspectRatio -> Automatic],
  Axes -> True]

data = (Table[
      z = homography[#1, R Exp[I t]]; {Re[z], Im[z], 0.}, {t, 0,
       2 \[Pi], dt}] &) /@ Tlist;
L = MeshRegion[Join @@ Most /@ data,
   Line[Join @@ (Partition[#1, 2, 1, 1] &) /@
      Partition[Range[7 Length[data]], 7]]];
f = RegionDistance[L];
\[Theta]1 = 0.08;
\[Theta]2 = 0.01;
z =.
R1 = ImplicitRegion[
   f[{x, y, z}] <= \[Theta]1, {{x, -4, 4}, {y, -4, 4}, {z, -2, 2}}];
S1 = DiscretizeRegion[R1, MaxCellMeasure -> 0.0001]


