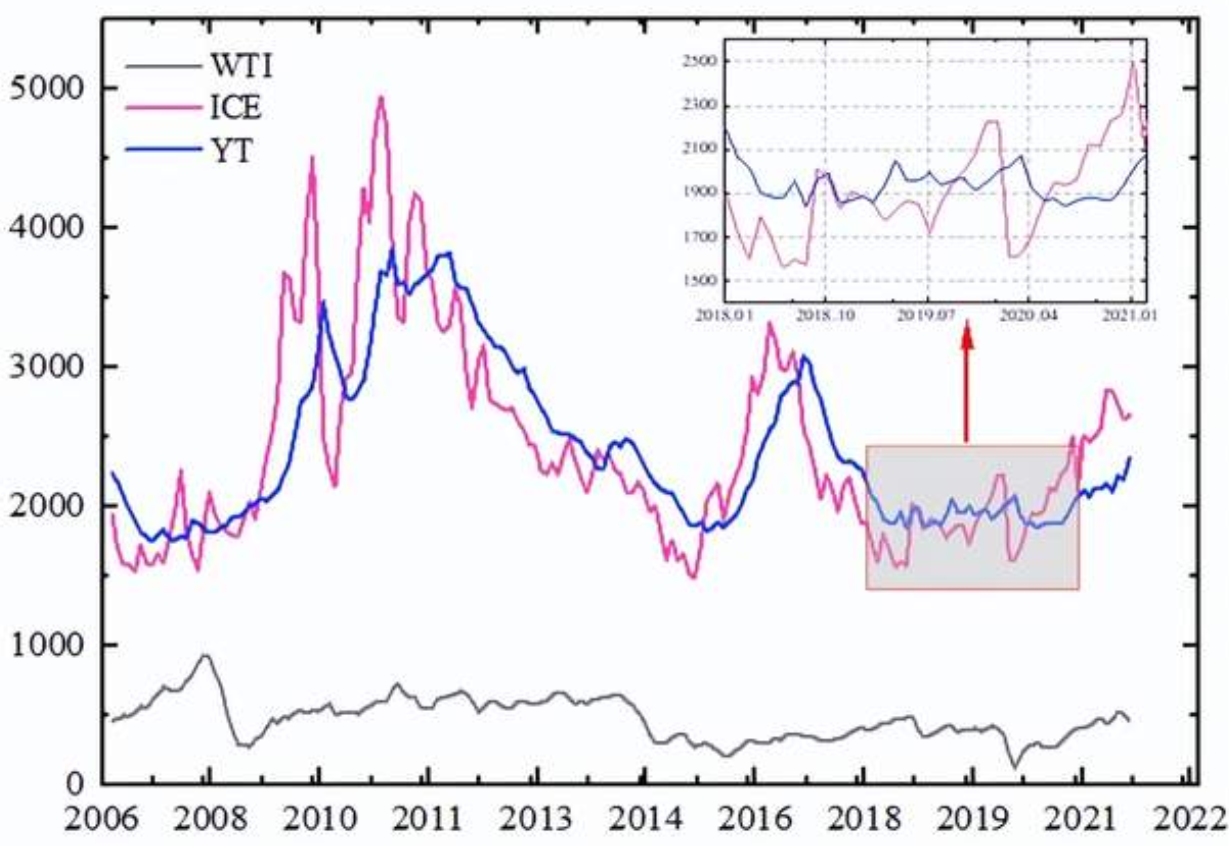
The overall image is the same as above, but the details are not clear in the full view. How can I, like in the image above, display an enlarged view of a specified local region alongside the main plot when drawing the complete image?
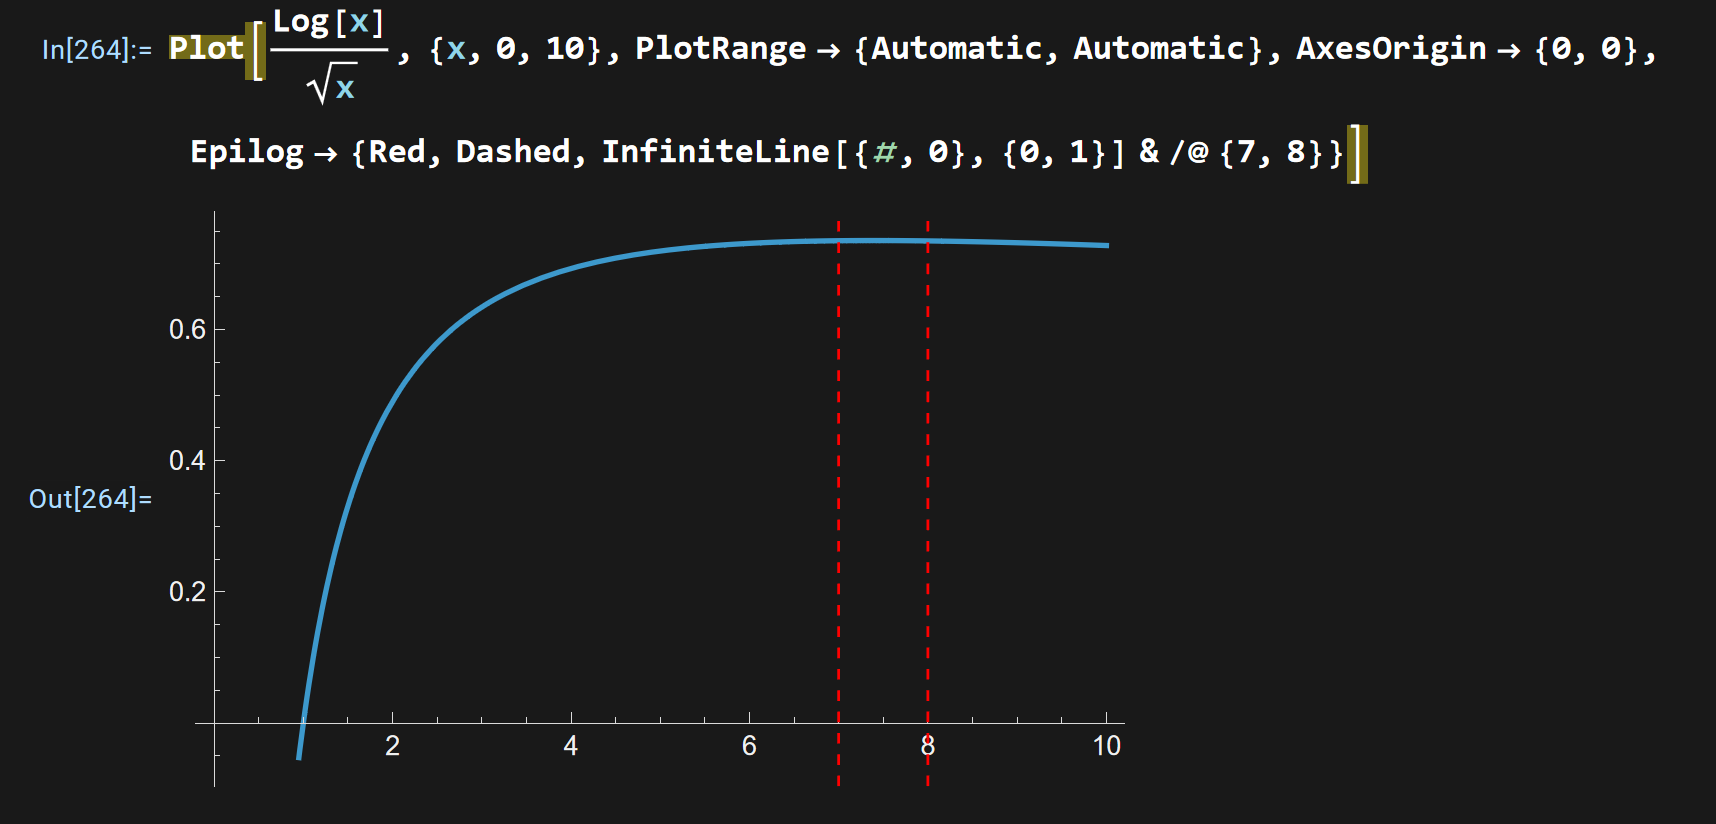
Here is a current example: when plotting the overall function image, it is impossible to clearly show the size relationship of the function values when the independent variable takes 7 and 8. The code is as follows:
Plot[Log[x]/Sqrt[x], {x, 0, 10}, PlotRange -> {Automatic, Automatic},
 AxesOrigin -> {0, 0},
 Epilog -> {Red, Dashed, InfiniteLine[{#, 0}, {0, 1}] & /@ {7, 8}}]
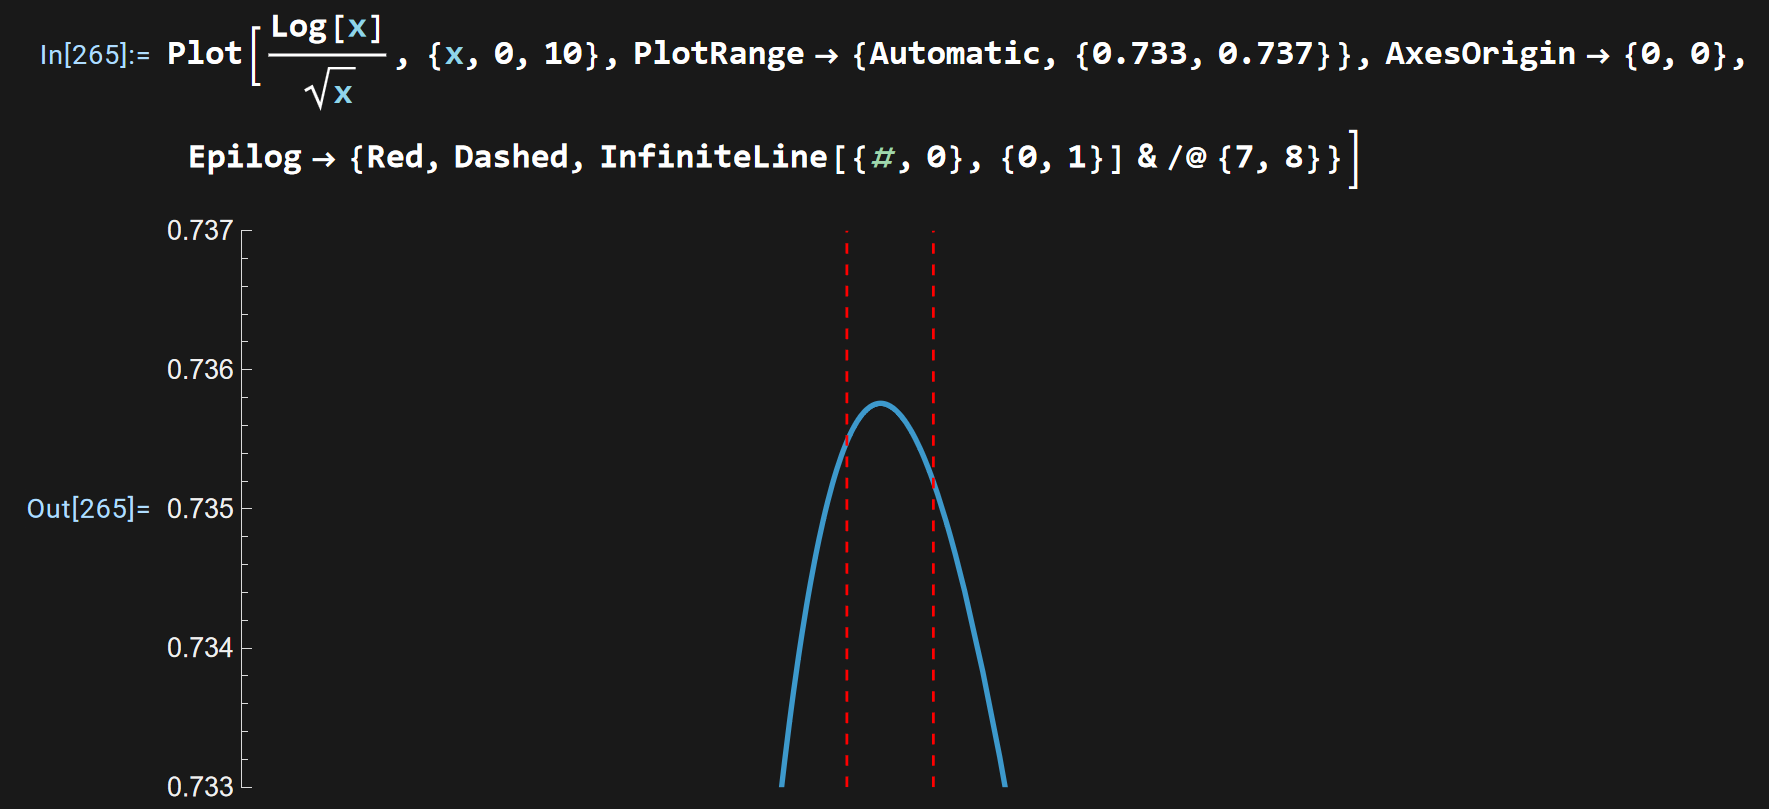
Below is the narrowed plotting range of the function, which is equivalent to locally magnifying the function image between the independent variables 7 and 8.
Plot[Log[x]/Sqrt[x], {x, 0, 10},
 PlotRange -> {Automatic, {0.733, 0.737}}, AxesOrigin -> {0, 0},
 Epilog -> {Red, Dashed, InfiniteLine[{#, 0}, {0, 1}] & /@ {7, 8}}]
My current idea is, how can I combine these two figures together, just like shown in the very first image above? For this example function, when plotting the overall image, display a locally magnified function image of the independent variable between 7 and 8 alongside it, so that the clear size relationship between the function values corresponding to these two independent variables can be distinctly shown.


