Group Abstract Group Abstract

Message Boards Message Boards

0
|
338 Views
|
2 Replies
|
2 Total Likes
View groups...
Share
Share this post:

Probability of tall-stemmed peas in F₃ generation from random F₂ hybridization

Posted 1 month ago

enter image description here

enter image description here

enter image description here

enter image description here

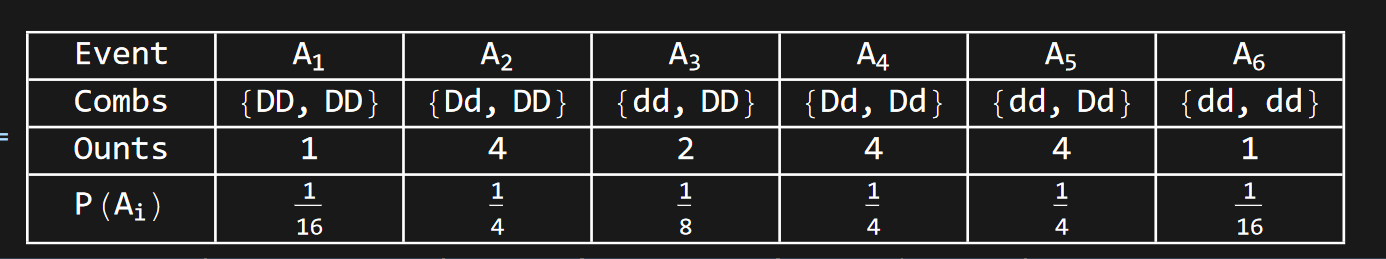
What are some good ways to create the table below based on the question?

enter image description here

Below is my attempt to code the table. I don’t know how to achieve the effect of the last row shown above when drawing it. Ideally, the matching types can be automatically entered and the corresponding probability values can be automatically generated.

data = GroupBy[Tuples[{DD, Dd, Dd, dd}, 2], Sort, Length];
events = Subscript[A, #] & /@ Range[6]
keys = Keys[data];
values = Values[data];
Grid[{{"Event", ## & @@ events}, {"Combs", Sequence @@ keys}, {"Ounts",
    Sequence @@ values} , {"P(\!\(\*SubscriptBox[\(A\), \(i\)]\))", 
   Sequence @@ (values/16)}  }, Frame -> All, Alignment -> Center, 
 ItemSize -> {5, Automatic}]

enter image description here

POSTED BY: Bill Blair
2 Replies
Posted 1 month ago

POSTED BY: Eric Rimbey
Posted 1 month ago

Thank you so much for this clear and detailed solution! It’s exactly what I needed to fix my table and understand the genetics probability better. I really appreciate your help!

POSTED BY: Bill Blair
Reply to this discussion
Community posts can be styled and formatted using the Markdown syntax.
Reply Preview
Attachments
Remove
or Discard