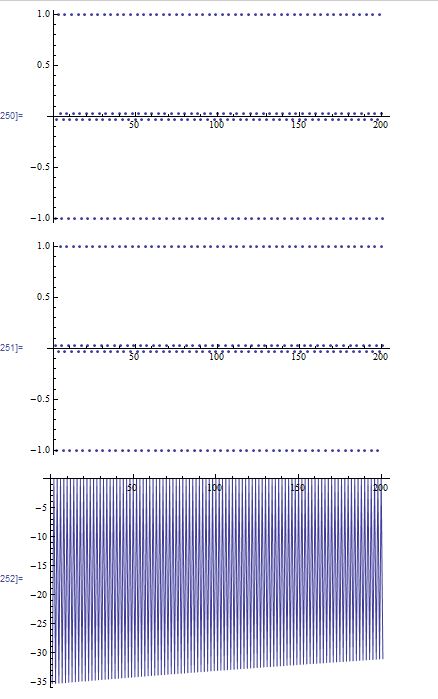
Compare the results of these two sets of code. The first one is based on the MRB constant (0.18785...), and the second one, 1/e (0.367879...). Can you change these 3 trig formulas so that 1/e (or any other constant) gives the same appearance as the MRB constant does? Or are these graphs from these 3 families of trig formulas unique to the MRB constant?
m = 0.1878596424620671202485179340542732300559030949001387861720046840\
89477231564660213703296654433107496903
ListPlot[Table[Sin[Pi/m*(5060936308 + 78389363/24*n)], {n, -100, 100}]]
ListPlot[Table[Cos[Pi/m*(5060936308 + 78389363/24*n)], {n, -100, 100}]]
ListPlot[Table[
  Tan[Pi/m*(5060936308 + 78389363/24*n)], {n, -100, 100}],
 Joined -> True]
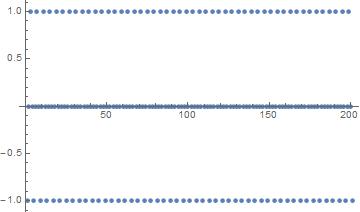
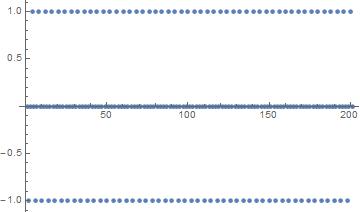
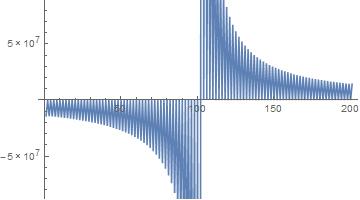
d = 1/E
ListPlot[Table[Sin[Pi/d*(5060936308 + 78389363/24*n)], {n, -100, 100}]]
ListPlot[Table[Cos[Pi/d*(5060936308 + 78389363/24*n)], {n, -100, 100}]]
ListPlot[Table[
  Tan[Pi/d*(5060936308 + 78389363/24*n)], {n, -100, 100}],
 Joined -> True]
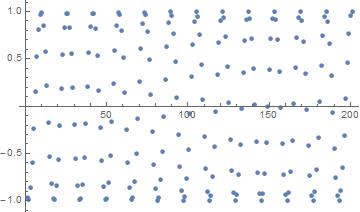
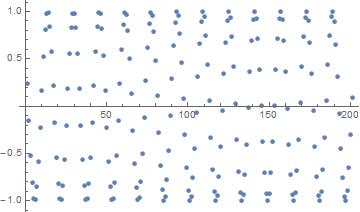
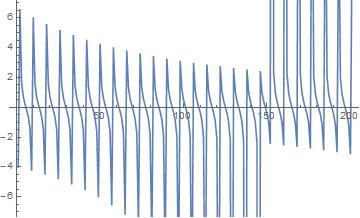
P.S. It doesn't take much to simply get "geometric" shapes out of this family of trig formulas. Try the following code:
d = 1/E - 10^-2
ListPlot[Table[Sin[Pi/d*(5060936308 + 78389363/24*n)], {n, -100, 100}]]
ListPlot[Table[Cos[Pi/d*(5060936308 + 78389363/24*n)], {n, -100, 100}]]
ListPlot[Table[
  Tan[Pi/d*(5060936308 + 78389363/24*n)], {n, -100, 100}],
 Joined -> True]
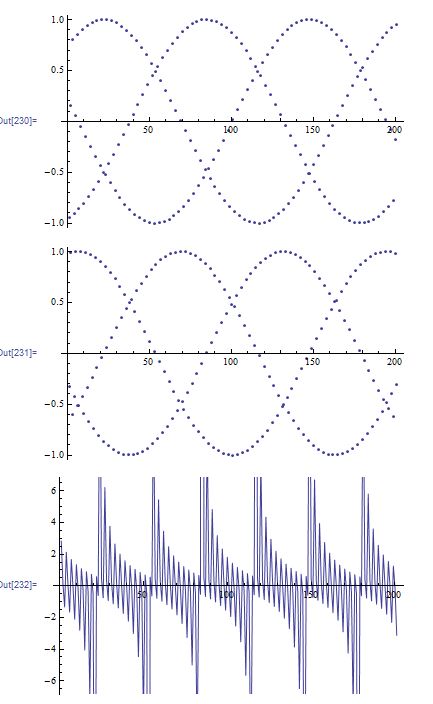
Plus, it don't take much error in the MRB constant's approximate value to really disfigure it's graphs. Try this code where you only use 12 digits of precision :for the MRB constant
m = 0.187859642462
ListPlot[Table[Sin[Pi/m*(5060936308 + 78389363/24*n)], {n, -100, 100}]]
ListPlot[Table[Cos[Pi/m*(5060936308 + 78389363/24*n)], {n, -100, 100}]]
ListPlot[Table[
  Tan[Pi/m*(5060936308 + 78389363/24*n)], {n, -100, 100}],
 Joined -> True]
