Message Boards Message Boards

1
|
2907 Views
|
1 Reply
|
2 Total Likes
View groups...
Share
Share this post:

What Mathematica 9 directives are equivalent to PlotStyle->Detailed?

I have transferred to a new university where I am using Mathematica 10. A student that is finishing up her PhD back at my old institution is still on Mathematica 9. Without recognizing the difference in versions, I developed a standard helper function to plot data in publishable-ready format using, as one of its options, PlotTheme->Detailed. I would very much like to know the list of options that are contained in that theme so that I can easily modify the function to be backwards compatible with Mathematica 9. Can anyone help? Thanks!

POSTED BY: Kevin Ausman

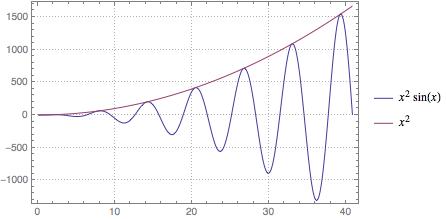
Here is an example of a plot with the "Detailed" PlotTheme in version 10:

plot = Plot[{x^2 Sin[x], x^2}, {x, 0, 13 \[Pi]}, PlotTheme -> "Detailed"]

FYI, it always generates a legend (even if there is only one curve).

But you can see the options that have been set for this plot (but which does not include the legending) using:

Rest[List @@ (First@plot)]

Taking the results of this as a guide one can begin to replicate the styling using

Plot[{x^2 Sin[x], x^2}, {x, 0, 13 \[Pi]}, 
 PlotLegends -> "Expressions", Frame -> True, Axes -> False, 
 GridLines -> Automatic, 
 GridLinesStyle -> 
  Directive[GrayLevel[0.4, 0.5], AbsoluteThickness[1], 
   AbsoluteDashing[{1, 2}]], 
 BaseStyle -> {FontFamily -> "Helvetica"},
 FrameStyle -> Gray]

So, comparing the PlotTheme -> "Detailed" in version 10:

enter image description here

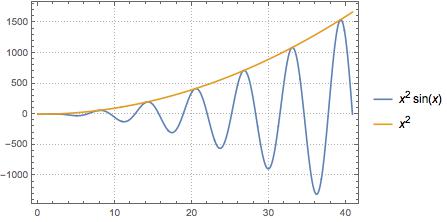
to the version 9 result using the options above:

enter image description here

POSTED BY: David Reiss
Reply to this discussion
Community posts can be styled and formatted using the Markdown syntax.
Reply Preview
Attachments
Remove
or Discard

Group Abstract Group Abstract