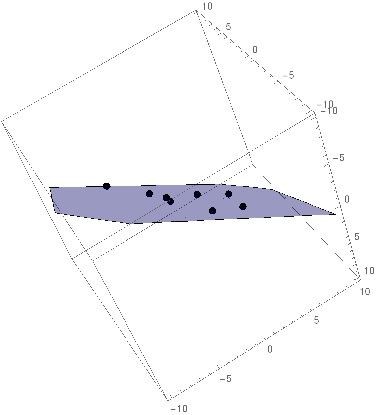
If you are working with a system of linear equations, such as plane equations, you simply set up the matrix form of the system of equation
Ax=b
Where the coefficients in the A matrix in each row are the x,y,z coordinates of the points you want to fit, and the b vector is all 1's.
Then solve Transpose(A) A == Transpose(A) using RowReduce..
If the system has a unique solution, the last column gives the coefficients of the plane equation a x + b y + c z = 1.
You can then plot the plane with ContourPlo3D and include the points using Graphics3D
Least Squares Plane

A given plane equation with d=1

In[123]:= f[x_, y_, z_] := 5 x - 7 y + 4 z - 1;

Generate some random (x,y) values

In[124]:= pnts = RandomInteger[{-5, 5}, {6, 2}];

Find the corresponding z values so that (x,y,z) is on the plane

In[125]:= eqns = f[#[[1]], #[[2]], z] & /@ pnts;

In[126]:= pntzs = z /. Solve[# == 0, z] & /@ eqns;

In[127]:= a = Join[pnts, pntzs, 2];

Add some noise to the points to move them off of the original plane

In[128]:= a = a + RandomReal[{-0.1, 0.1}, Dimensions[a]];

Set up the least squares problem A^\[Transpose] A x=A\[Transpose]b

In[129]:= b = {Table[1, {Length[a]}]}\[Transpose];

In[130]:= a\[Transpose].a

Out[130]= (35.7287  -22.9552 -83.1553
-22.9552    70.0013    147.387
-83.1553    147.387    353.546

)

In[131]:= a\[Transpose].b

Out[131]= (7.08051
-12.0304
-28.3427

)

In[132]:= sol = RowReduce[Join[a\[Transpose].a, a\[Transpose].b, 2]]

Out[132]= (1    0. 0.  4.84884
0   1 0.  -6.65992
0   0 1   3.8367

)

Extract the solution

In[133]:= {a1, b1, c1} = sol[[All, 4]];

Plot the resulting plane along with the points

In[134]:= Show[ContourPlot3D[
  a1 x + b1 y + c1 z == 1, {x, -10, 10}, {y, -10, 10}, {z, -10, 10},
  Mesh -> None, ContourStyle -> {Blue, Opacity[0.4]}],
 Graphics3D[{PointSize[0.02], Point /@ a}]]
