Message Boards Message Boards

Parametric Plotting A Numerical Solution to a Set of 4 Differential Eq's

Hi guys, I have been working on a project where I have to model the orbital velocity of a potential spacecraft and as I'm not too familiar with Mathematica it has been quite difficult. My question is if anyone could point out to me the error in my code or perhaps a way in which I could get the result to plot.

Here are the 4 differential equations that I need to solve for numerically using "NDSolve":

enter image description here

enter image description here

Where Re is equivalent to the radius of the earth 6400000m

g is equivalent to acceleration of gravity 9.8m/s

V_0 is also equal to a velocity of 7919.6m/s

Over a period of 5077.6 seconds plot I'm looking to create should be similar to the plot shown below. Note: the plot shown below is in imperial but it represents the radius of the earth. The final plot from Mathematica would be somwhere in the 6*10^6 range.
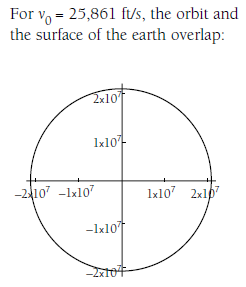
enter image description here

Here is the code that I put into Mathematica and can't seem to get a result from Note: Vr=v, Vtheta = x, theta =y & r=z

solution = NDSolve[{

   v'[t] == (((x[t])^2)/z[t]) - 9.8*((6400000/z[t])^2),
    x'[t] == (-v[t]*x[t])/(z[t]),
    z'[t] == v[t], 
   y' [t] == x[t]/z[t], 
   v[0] == 0,
    x[0] == 7919.58,
    z[0] == 6400000,
    y[0] == 0 }, 
  {v, x, z, y},
  {t, 0, 5077.6}]
ParametricPlot[Evaluate[{z[t], y[t]} /. s], {t, 0, 5077.6}]

any ideas?

POSTED BY: John Thacher
2 Replies

Why did you do Evaluate[{ z[t], y[t]} /. s] when your solution is named solution, not s? Also, you need to separate the NDSolve call from the ParametricPlot call, either with a semicolon or by putting them into separate input lines.

POSTED BY: Frank Kampas

That helped my case so much but the it doesn't seem to be in the circular form that I'm looking for Here is where my code is at now:

tmax = 5077.6;
s = NDSolve[{

    v'[t] == (((x[t])^2)/z[t]) - 9.8*((6400000/z[t])^2),
     x'[t] == (-v[t]*x[t])/(z[t]),
     z'[t] == v[t], 
    y' [t] == x[t]/z[t], 
    v[0] == 0,
     x[0] == 7919.6,
     z[0] == 6400000,
     y[0] == 0}, 
   {v, x, z, y},
   {t, 0, tmax}];
ParametricPlot[Evaluate[{z[t], y[t]} /. s], {t, 0, tmax}]

This gives me a plot that seems to follow the period of the earth as well as the distance from the center of the earth but I'm not quite sure how I can use the information I generated from the numeric solve to show the relation of radius to radial displacement

enter image description here

POSTED BY: John Thacher
Reply to this discussion
Community posts can be styled and formatted using the Markdown syntax.
Reply Preview
Attachments
Remove
or Discard

Group Abstract Group Abstract