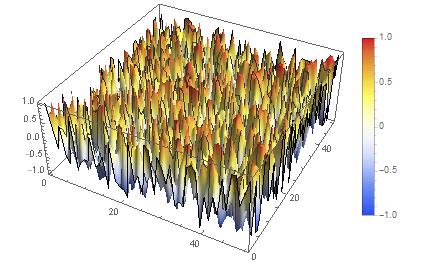
Visualisation of computational results greatly enhances orientation and quick signal detection. Therefore the visualisation tools become important part of decision making process and control mechanisms for efficient computation. Correlations do belong to that category large data analysis, including the dependency structure can be elegantly reviewed with visual colour coding to provide quick answers for clustering and similarity of association.

 Attachments: