Hi community,
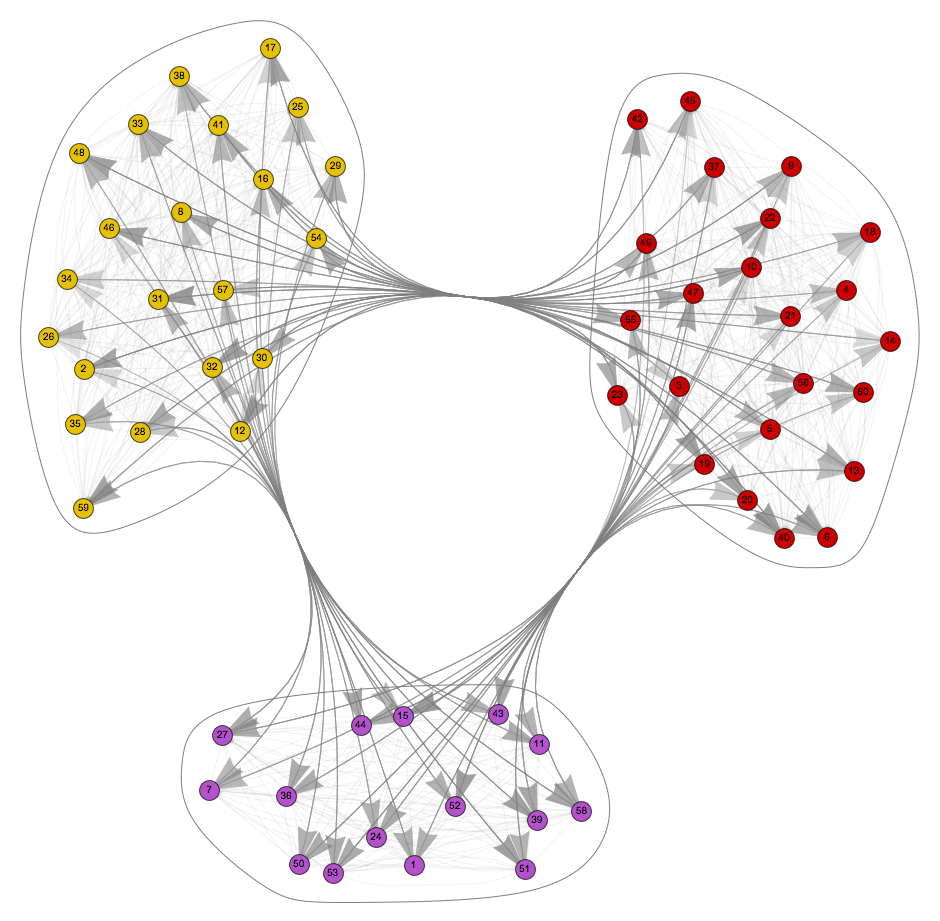
I got two small styling problems using the two mentioned functions. First of all I have a graph of which I'd like to have a community graph plot. I wonder if there is a way style the arrows between the communities? It looks like something like this.

Code:
ef[pts_List, e_] := Block[{size = .01, offset = 0.99}, {Arrowheads[{{size, offset}}], Arrow[pts]}]; CommunityGraphPlot[ RandomGraph[{60, 1500}, DirectedEdges -> True, EdgeStyle -> Directive[Opacity[.1], Gray], EdgeShapeFunction -> ef, GraphLayout -> Automatic]]
My second problem is about vertex styling using GraphPlot. Is there a way to set a specific size for each vertex using VertexRenderingFunction? I like to use GraphPlot because my network contains a lot of loops.