Message Boards Message Boards

Creating a Map of Sierra Leone

Posted 10 years ago

Hi I am trying to make a map of Sierra Leone and am running into trouble. I am brand new at this so I will explain what I have done so far. Please don't be impressed by all the fancy code that follows. I have no idea what I am doing. The code was lifted from random places around the web.

SL has 4 provinces: Northern, Southern, Eastern, and Western, which are diced up into 14 districts as shown here:

http://en.wikipedia.org/wiki/Administrative_divisions_of_Sierra_Leone

I found I could create Entity's for 13 of the 14 districts via the following:

 districts = {"Bo Sierra Leone", "Bombali", "Bonthe District", "Kailahun District", 
"Kambia District", "Kenema District", "Koinadugu District", "Kono District", 
"Moyamba District", "Port Loko District", "Pujehun District", "Tonkolili District", 
"Western Rural District", "Western Urban Sierra Leone"};

    slDistricts = SemanticInterpretation /@ districts
    GeoListPlot[slDistricts, ImageSize -> Large, GeoLabels -> True]
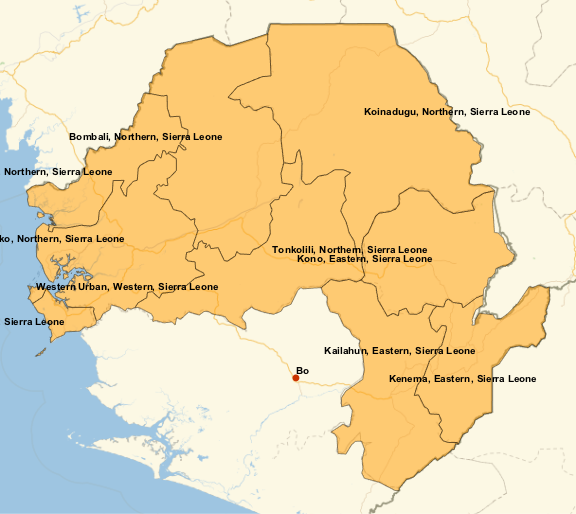
Output From GeoListPlot

but it fails to make the district of Bo and instead returns a city. There are apparently two problems. One is that SemanticInterpretation fails to make an Entity for the district of Bo which seems to bode ill for me. The other is that I can't get it to generate maps of the other 3 districts in Southern either. Is there some way to "teach" SemanticInterpretation that there exists a an AdministrativeDivision in Sierra Leone named Bo and also to somehow update the information that the Geo routines are using so that they'll plot the 4 districts in Southern.

I also tried plotting single districts and it fails for all the ones in Southern. As you can see I could get maps of districts in Northern and Western, but the attempts to map the 4 districts in Southern failed.

GeoGraphics[{EdgeForm[Black], FaceForm[Red],  Polygon[Entity["Country", "SierraLeone"]]}]
GeoGraphics[{EdgeForm[Black], FaceForm[Red],  Polygon[Entity["AdministrativeDivision", {"Kambia", "Northern", "SierraLeone"}]]}]
GeoGraphics[{EdgeForm[Black], FaceForm[Red],  Polygon[Entity["AdministrativeDivision", {"WesternRural", "Western", "SierraLeone"}]]}]
GeoGraphics[{EdgeForm[Black], FaceForm[Red],  Polygon[Entity["AdministrativeDivision", {"Moyamba", "Southern",      "SierraLeone"}]]}]
GeoGraphics[{EdgeForm[Black], FaceForm[Red],  Polygon[Entity["AdministrativeDivision", {"Bonthe", "Southern", "SierraLeone"}]]}]
GeoGraphics[{EdgeForm[Black], FaceForm[Red],  Polygon[Entity["AdministrativeDivision", {"Pujehun", "Southern",  "SierraLeone"}]]}]
GeoGraphics[{EdgeForm[Black], FaceForm[Red],  Polygon[Entity["AdministrativeDivision", {"Bo", "Southern", "SierraLeone"}]]}]
POSTED BY: John Pearson
6 Replies
Posted 10 years ago

It's improving and I appreciate the effort. BUt it isn't quite there yet. What I really need is for GeoRegionValuePlot to work on these places. I think it fails because if you run, say, AdministrativeDivisionData[Flatten[prefectures] , "Position"] the output is:

{Missing["NotApplicable"], Missing["NotApplicable"], 
 Missing["NotApplicable"], Missing["NotApplicable"], 
 Missing["NotApplicable"], Missing["NotApplicable"], 
 Missing["NotApplicable"], Missing["NotApplicable"], 
 Missing["NotApplicable"], Missing["NotApplicable"], 
 Missing["NotApplicable"], Missing["NotApplicable"], 
 Missing["NotApplicable"], Missing["NotApplicable"], 
 Missing["NotApplicable"], Missing["NotApplicable"], 
 Missing["NotApplicable"], Missing["NotApplicable"], 
 Missing["NotApplicable"], Missing["NotApplicable"], 
 Missing["NotApplicable"], Missing["NotApplicable"], 
 Missing["NotApplicable"], Missing["NotApplicable"], 
 Missing["NotApplicable"], Missing["NotApplicable"], 
 Missing["NotApplicable"], Missing["NotApplicable"], 
 Missing["NotApplicable"], Missing["NotApplicable"], 
 Missing["NotApplicable"], Missing["NotApplicable"], 
 Missing["NotApplicable"], Missing["NotApplicable"]}

You can try to run the following code and you'll see that the map it produces doesn't color any of Guinea nor the districts in Sierra Leone that are in the Southern District.

provinces = CountryData["SierraLeone", "AdministrativeDivisions"];
districts =   AdministrativeDivisionData[#, "Subdivisions"] & /@ provinces;
districts = Flatten[districts];
regions = CountryData["Guinea", "AdministrativeDivisions"];
prefectures =   AdministrativeDivisionData[#, "Subdivisions"] & /@ regions;
counties = CountryData["Liberia", "AdministrativeDivisions"];
alladmindistricts = Flatten[Join[prefectures, districts, counties]];
Print["Length[alladmindistricts]=", Length[alladmindistricts]];
rints = RandomInteger[100, 63];
GeoGraphics[ MapIndexed[{EdgeForm[Black], FaceForm[ColorData[1][#2[[1]]]], Polygon[#]} &, alladmindistricts]]
GeoRegionValuePlot[Thread[alladmindistricts -> Log10[rints]], 
 ColorFunction -> ColorData["Rainbow"], 
 GeoBackground -> GeoStyling["StreetMap"], ImageSize -> 700]
POSTED BY: John Pearson
Posted 10 years ago

I see that I have made an error in the above code. In the following you can see that The corrected code also fails to return positions of the Prefectures in Guinea.

regions = CountryData["Guinea", "AdministrativeDivisions"]
prefectures = Flatten[AdministrativeDivisionData[#, "Subdivisions"] & /@ regions];
(*This next one fails *)
 positions    =  AdministrativeDivisionData[#, "Position"] & /@ prefectures
 guineagons  =  AdministrativeDivisionData[#, "Polygon"] & /@ prefectures;
    (* This plots all of the prefectures of Guinea *)
 GeoGraphics[{EdgeForm[Black], FaceForm[Red], guineagons}]
 provinces = CountryData["SierraLeone", "AdministrativeDivisions"];
 districts =  AdministrativeDivisionData[#, "Subdivisions"] & /@ provinces;
 districts = Flatten[districts];
 lendist = Length[districts];
 rints = RandomInteger[10, lendist];
  (*  this plots some, but not all of the districts of Sierra Leone *)

  GeoRegionValuePlot[Thread[districts -> Log[rints]]]
   lenp = Length[prefectures];
   rints = RandomInteger[10, lenp];
  (* This doesn't plot any of the prefectures of Guinea *)
  GeoRegionValuePlot[Thread[prefectures -> Log[rints]]]
POSTED BY: John Pearson
Posted 10 years ago

I guess this is a cleaner way to demonstrate the difficulties. It solves the troubles I was having with SemanticInterpretations but not the problem with the maps.

For Sierra Leone:

provinces = CountryData["SierraLeone", "AdministrativeDivisions"]
districts =  AdministrativeDivisionData[#, "Subdivisions"] & /@ provinces;
GeoGraphics[{EdgeForm[Black], FaceForm[Red],     Polygon[#]}] & /@ districts

and Guinea below. As you can see it fails entirely on all the prefectures of Guinea. I did the same thing on the US (states and counties and it failed on Alasksa but I think all the other states worked.

regions = CountryData["Guinea", "AdministrativeDivisions"]
prefectures =  AdministrativeDivisionData[#, "Subdivisions"] & /@ regions
GeoGraphics[{EdgeForm[Black], FaceForm[Red], Polygon[#]}] & /@ prefectures
POSTED BY: John Pearson

Give it a try now, Wolfram|Alpha has updated its data and now your examples work as expected:

regions = CountryData["Guinea", "AdministrativeDivisions"]
prefectures = AdministrativeDivisionData[#, "Subdivisions"] & /@ regions

GeoGraphics[
 MapIndexed[{EdgeForm[Black], FaceForm[ColorData[1][#2[[1]]]], 
    Polygon[#]} &, prefectures]]

Guinea

And also for Sierra Leone:

provinces = CountryData["SierraLeone", "AdministrativeDivisions"]
districts =  AdministrativeDivisionData[#, "Subdivisions"] & /@ provinces;

GeoGraphics[
 MapIndexed[{EdgeForm[Black], FaceForm[ColorData[1][#2[[1]]]], 
    Polygon[#]} &, prefectures]]

Sierra Leone

Thank you for reporting this issue. Our developers team is looking into it.

POSTED BY: EDITORIAL BOARD
Posted 10 years ago

You might have them look at Guinea while they're at it. It seems to get worse. Guinea is similar in that it is chopped into 7 "regions" which the following does fine on: GeoListPlot[CountryData["Guinea", "AdministrativeDivisions"]]

. However the entire country has 33 prefectures which I am unable to plot. You can try this:

pnames = {"Conakry Prefecture", "Gaoual Prefecture", "Gueckedou Prefecture", "Macenta Prefecture", "Dabola Prefecture",  "Kissidougou Prefecture", "Dinguiraye Prefecture", "Telimele Prefecture", "Boffa Prefecture", "Kouroussa Prefecture",  "Siguiri Prefecture", "Pita Prefecture", "Nzerekore Prefecture", "Yomou Prefecture", "Dubreka Prefecture", "Forecariah Prefecture", "Kerouane Prefecture", "Coyah Prefecture", "Dalaba Prefecture", "Beyla Prefecture", "Koubia Prefecture", "Kindia Prefecture", "Lelouma Prefecture", "Lola Prefecture", "Boke Prefecture", "Mali Prefecture", "Mamou Prefecture", "Mandiana Prefecture",   "Faranah Prefecture", "Kankan Prefecture", "Fria Prefecture", "Labe Prefecture", "Koundara Prefecture"}

Prefectures = SemanticInterpretation /@ pnames

GeoListPlot[Prefectures] fails. (edit: GeoListPlot[pnames] -> GeoListPlot[Prefectures]

POSTED BY: John Pearson
Reply to this discussion
Community posts can be styled and formatted using the Markdown syntax.
Reply Preview
Attachments
Remove
or Discard

Group Abstract Group Abstract